


-
-
-
-
Santa Claus Rally
-
-
-
-
-
-
Santa Rally
Santa Claus Rally Guide
by Michael H. Bond
TSP Smart & Almanac Smart Investors
The Turn-of-the Year Seasonal Effects
The Santa Claus Rally has become synonymous with an expected end-of-year rally in the stock market, but it has varying definitions leading to confusion among the media and investors. While I hope to clear up some of the confusion, our main focus should be on the actual market action to see if a seasonal effect truly exists and more importantly is it tradable. The explanations for the stock market seasonal tendencies are many and we will touch on them, but consistent tradable tendencies are what we are looking for. Since varying definitions exist, we need to frame the discussion.
I prefer to use “Turn-of-Year” (TOY) to describe the seasonal effects that exist at the end of the year and the beginning of the New Year. It is also an umbrella term to frame the varying effects mentioned by the media and other analyst to include the Santa Claus Rally, the December effect, the January Effect, the Holiday effects (Thanksgiving, Christmas, New Year’s), the Turn-of-Month effects and Tax Payment effects and others. Each effect has its own explanation for what drives it and some effects are over-lapping in time, but we found the culmination of all of these effects create distinguishable results on the stock indexes which can be useful to investors.
Key factors in analyzing the “The Santa Claus Rally” are the time frames examined and the indexes used. Our Almanacs and data show the SP500 (TSP C fund) has seasonal tendencies but they are less than the Dow Jones Industrial Index which again is less than the small capitalized stocks such as the Russell 2000 index or the TSP S fund. While seasonal tendencies have been studied for over one hundred years, the drivers of these tendencies have changed with changing tax laws and the investing community. Looking back beyond 1950 provides good academic reading, but is less important for today’s investors than the last 60 years and last 25 years. And of course too short a period does not provide enough data points.
Depending on the analyst or definition, the Santa Claus Rally starts after Thanksgiving, the beginning of December, the last half of December or the last five days of December or after Christmas and of course ends of varying dates. The January Barometer is either the first 5 days or entire month of January. WikiInvest, Wikimedia, and Investopedia all use slightly different definitions adding to the confusion. Let’s take a look at their definitions:
Investopedia: A surge in the price of stocks that often occurs in the week between Christmas and New Year's Day.
Wikipedia: A Santa Claus rally is a rise in stock prices in the month of December, generally seen over the final week of trading prior to the New Year.
WikiInvest: The time period associated with the Santa Claus Rally is the last five trading days of December and the first two trading days of January.
First let’s look at some of the history and try to clear up some of the confusion. Then we will frame our own analysis for proper comparisons.
The Santa Claus Rally
In 1942, S.B. Wachtel presented in the The Journal of Business of the University of Chicago evidence from 1927 to 1942 of a December-to-January seasonal rise in the Dow Jones Industrial Average (DJIA) and he listed possible causes as tax-selling depressing prices in December followed by a rise into January, a liquidity preference before Christmas, a general good-feeling around the holidays among others. Other academic studies were to follow but the term Santa Claus Rally was made popular around 1972 in a Stock Trader’s Almanac (The Almanac Investor).
The Almanac Investor refers to the Santa Claus Rally as the last five trading days of December and first two trading days of January. The Santa Rally--like the January Barometer--is considered more of an “Early Warning System” for the coming year than a speculative trade. Their theory is simply that if one of the best and most consistent stock market trends fails; watch out for the rest of the year.
Since monthly returns are easier to find and analyze, many journalists take the easy route and only compare full month returns. But a proper analysis requires a closer look at the daily price progression through this time frame. We agree that tax loss selling is part of the effect, so it makes sense that investors are going to do the majority of their selling prior to starting the Christmas holiday thus depressing prices of some stocks that impact the indexes during the month of December. But once the selling pressure lets up, buying will begin.
A Turn-of-Month effect exists in the indexes for many, but not all months due to the end-of month payment of payrolls that also include deposits in retirement accounts. In turn, these funds are invested in the major stock indexes. We can see this slight bump around the end and beginning of most months and to a lesser degree the middle of the month. But now consider that many employers delay matching contributions in retirement accounts and bonuses until the end of the year increasing the flow of funds into the indexes. How and when these funds flow into the market partially determines the seasonal effects of each specific index.
We will look at the following TOY time frames:
1. Thanksgiving and the end of November.
2. December: Closing prices on the last day of November through the last day of December
3. January: Closing prices on the last day of December through the last day of January
4. Santa Claus Rally: Last 5 trading days of December and first 2 trading days of January
5. Best Dates: The best dates to enter in December and best day to exit in January based on the TSP & Vanguard Smart Investor's almanacs.
Our study focuses on the SP500 index and the Russell 2000 index. We calculated two unique numbers in addition to the cumulative returns. First is the percent of the annual return captured in these short time frames. Second, the ratio of the average daily returns within the examined timeframe divided by the average daily return of the SP 500 index for the full year. A ratio of "3.0" means the average daily return during the period is 3 times the average daily return of the SP500 index the entire year. We also present the Win-Loss Data for each trade. We have seen journalist state the seasonal effects appear to be diminishing after presenting the raw numbers. But remember since 2000 the market as a whole has significantly under-performed the bull market preceding it. The percent of annual returns and the daily ratios allow us to see the relative numbers.
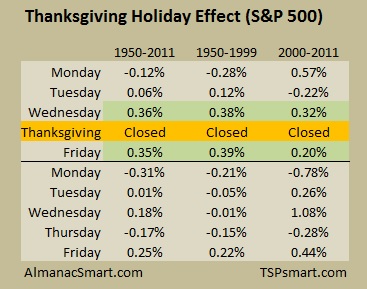
Thanksgiving (with Turn-of-Month)
The Holiday Effect of Thanksgiving requires careful examination from multiple angles to cull out the normal Turn-of-Month effects from the days around Thanksgiving. In some years the Friday after Thanksgiving is the last trading day of November while in others up to six trading days are left. The bottom line is that the Wednesday before and the Friday after Thanksgiving have been the two best trading days in November accounting for 1/3 of the total month’s average returns from 1950-2011. The remaining trading days in November after Thanksgiving have been neutral on average.
If we examine the End-of-November regardless of Thanksgiving, we find the last 6 trading day’s equal approximately 62% of the entire month’s average return since 1950 and also since 2000 with a difficult to trade 1% gain on average. Unfortunately the first two trading days of December are typically neutral not adding to a possible trade. The two best trading days described above account for two thirds of this End-of-Month gain. Since Thanksgiving is always on Thursday we can produce the following weekday table that includes trading days in both November and December. While these numbers appear small consider that .35% is ten times the daily average for the stock market over the last 60 years or annualized at a 88% return. For the average trader we do not find this trade of .71% compelling. But there appears to be a consistent seasonal tendency associated with Thanksgiving to include a negative Monday following Thanksgiving.
The Santa Claus Rally and TOYs
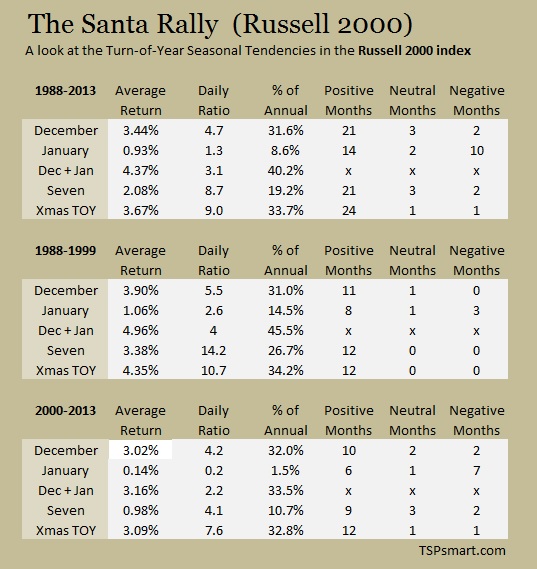
On the other hand, TSP & Vanguard Smart Investor's Turn-of-Year trade is compelling especially for the small capitalized stocks. In the last 26 years, only one year had negative returns in the Russell 2000 index and it has provided a 3.67% return on average for a minimal number of days of exposure. This return is one third of the entire annual return on average of the Russell 2000 index from 1988 – 2013. While we do not recommend speculating with core retirement funds, increasing exposure to equities only during this time presents good risk mitigation. It does not take much imagination to name this seasonal tendency, the “Christmas TOY” as presented on the table below. (Note: TSP & Vanguard Smart Investor reserves the formula for determining the dates each year for our members who have access to our unique almanacs and other seasonal cherry picking trades at TSPsmart.com)
“Seven” represents the last five days of December and the first two trading days of January. This trade performed well until 2000 when it appears the effect has broadened out slightly. Note: We do not see an advantage to holding small cap stocks the entire month of January although it has performed less badly than the SP500 since 2000. The month of December remains the best month of the year for the stock market, but the early part of December consistently sees selling pressure. A delayed entry as seen in our "Christmas TOY" strategy greatly increases your risk-adjusted returns. The numbers are presented in the tables below.
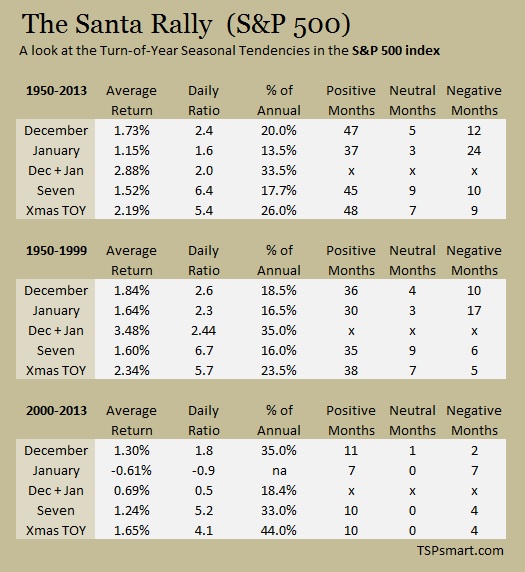
Any way you look at it, a Turn-of-Year effect consistently exists in both indexes. If the stock market gains were even throughout the year each month would capture 8.5% of the annual returns. Yet historically you would have captured a third of the annual returns in only one or two of the months examined. The narrower timeframes provide the bulk of the gains. If you subtract these two timeframe's returns from the monthly returns, you find the rest of the month's returns are not as compelling and since 2000 they have been negative for the SP 500. You will also note the Russell 2000 provides not only higher returns, but the TOY captures a greater amount of its own annual return. (Note: The Daily Ratio in both tables uses the daily average return of the SP500 index (.034%) in the denominator for a cross comparison between the indexes)
Financial Journalism is not Analysis
Google “Santa Rally” and you will find many articles and definitions of “Santa Clause Rally”, but you will notice often the details are lacking or misleading. You will also see journalist reference other journalist data which was questionable to begin with. Some of the common fallacies in analyzing these and other seasonal effects are a lack of clear definitions (and understanding), the sole use of monthly date (vices daily data), not defining for the reader the details of the analysis (time frames, indexes used, how invested when out of equities) and frankly bad data. I have seen side-by-side comparisons of DJIA which incorporates dividends to the S&P 500 index which excludes dividends. In the short term (days) this is fine, but long term the dividends have averaged half of the stock markets returns and thus half of the DJIA gains. You will also find that the sources deny that seasonal effects exist in May, but the same sources tout the beginning of the strongest season for equities in October. Which is it?
We do agree the following are issues for trading seasonal tendencies and need to be considered:
1. Taxes unless in a tax-deferred account (401K, IRA, GOV TSP).
2. Brokerage commissions and fees as a percentage of the trade.
3. Ability to keep the Bid-Ask spread small especially with small cap funds.
4. A large enough expected average gain over many years of making the trade.
5. Ability to properly time entry and exit.
Bottom-line
Since many investors are already invested in the stock market, how can one capitalize on the TOY? Older and conservative investors who are not 100% exposed to the stock market could increase exposure to the market during this time of the year to bump up their annual returns. The trade minimally increases ones market risk exposure while capturing a large percent of the average annual returns. The trade requires proper timing, a tax deferred account, minimal trading costs and the use of larger liquid funds to keep the bid-ask spread low. One also needs to understand the returns presented are average returns and individual years vary greatly. And of course, past performance is no guarantee of future performance.
Learn More About TSP & Vanguard Smart Investor
for reluctant and serious investors
If you want detailed trading day (versus) calendar day seasonal data, you might want to check out our almanacs. We also provide the daily seasonal after eliminating the volatile bear market years - our charts show the effect. We provide the SP500 index with over 60 years of data and the SP500 and the non-sp500 companies data since 1988. All presented side-by-side and with charts that paint the picture. The Santa Rally stands out, but so do other patterns.