

-
-
-
-
-
-
Risk Matters
-
-
-
-
risk matters
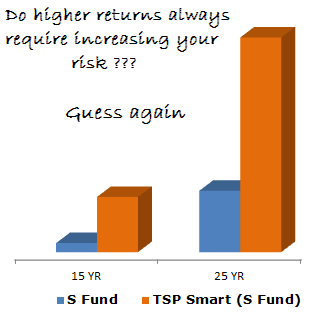
Figure 1. Comparison of Returns of Dow Jones Total Market Completion Index (S Fund Tracked Index) in blue to the same index using the TSP Smart Model.
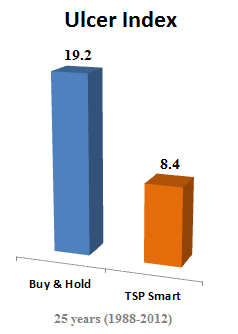
Compare the total returns of Buy & Hold to a Seasonally Modified Buy & Hold Strategy as seen in Figure 1. Impressive, but any smart investor knows this is only half the story. The other half is risk and unlike other strategies, it is the reduction of market risk that leads to the increased returns of a well-designed seasonal strategy. The ulcer index is a stock market risk indicator devised by Peter Martin and published in his book The Investors Guide to Fidelity Funds. It measures only the volatility of an asset in the downward direction; in other words, only the amount of drawdowns over a period of time. The returns gained in our Seasonally Modified Buy & Hold Strategy were achieved due to missing the drawdowns of the weak season as measured by the ulcer index seen in Figure 2 or Market Exposure Risk in Figure 3.
The academic or the efficient market hypothesis perspective on portfolio returns and risk typically states in order to increase your return you have to increase the risk level of your portfolio. For example, you could double your leverage and double your investment return, but you also double your risk since a decline of 50% would wipe out 100% or your equity. In contrast, the Almanac Smart investor believes it is the reduction of risk (market exposure) that leads to higher long-term returns by applying a seasonal filter. Buy and hold may beat a seasonal strategy in some years as seen on the chart below, but will fall behind a seasonal strategy over the full market cycle (Bull/Bear) due to the increased market exposure of the weak season of the markets.
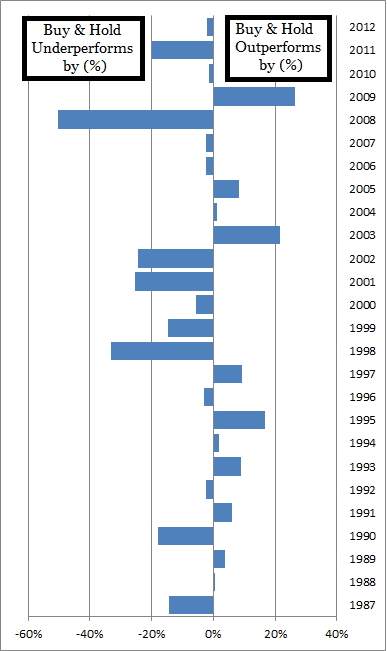
Figure 4. Chart compares Advantage S model annual returns to the index measured by percentage of over and under performance on a yearly basis. The cumulative result is seen in figure 1.
Other conditions obviously affect returns each year besides the seasonal patterns. One does not have to be all in or all out of the market. Adjusting allocation percentages is a good way to take into consideration other factors and achieving your desired risk exposure. If you are retired, a reduced exposure to the market is usually recommended. A younger investor might chose to be 100% invested in equities during the seasonally strong time of year. A retiree's maximum exposure might only be 50% and only during the strong season. The retiree might allocate an additional 25% to small caps (S Fund) to capture the Turn-of-Year effect if the conditions are favorable. With TSP funds, one's risk comfort level can be managed by what percent of your portfolio is not invested in the G fund, the only low risk fund.
The most important consideration of risk is avoiding losses. Sounds simple and obvious, but it does get lost in many measures of risk. Bear markets in the stock market typically wipe out 50-80% of the previous bull market. A 50% drawdown of your portfolio requires a 100% gain to break even. While losses occur during the strong season, the bulk of the drawdowns occur in the weak season during bear markets. In figure 3, you will note two individual years where the buy and hold investor earned a higher annual return in excess of 20% above the TSP Smart Investor model. Both these out performances occurred after the major bear market bottomed during the weak season but also bounced back significantly. We call this a seasonal reversal and part of our analysis looks for conditions were this may occur so we can capture more returns. But even if one misses the reversal, the TSP Smart Advantage S model still significantly beat the buy and hold portfolio during both bear markets and reversals. This is actually where much of the seasonal strategy's advantage exists.
Take a look at the under-performance in the years proceeding these reversal years. If you lose 50% one year, then gain 50% the next, your gain is on half the money you started with, and you are still down 25% from your original capital. This is why avoiding the larger losses trumps the loss of gains that are missed during the weak season. While the models presented on the website invest 100% during strong seasons and 0% during weak season for performance tracking results, there are times when exposures could or should be adjusted to further reduce risk of losses or capture gains.
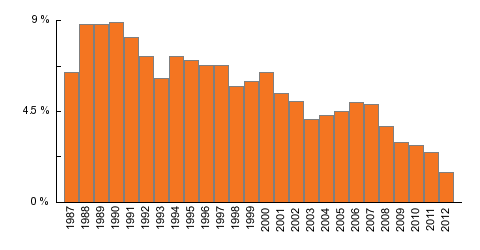
Figure 5. G Fund annual return (Reference: TSP official website)
But what about the low money market and TSP G Fund return? It is true money market and the G Fund's return are historically low, but this is due to extreme monetary policy and the fact that real interest rates are set below inflation. On the flip side, the ultra-loose monetary policy and resulting low rates of return on interest bearing assets has pushed investors out on the risk spectrum in order to seek higher returns--in other words, money has moved into the stock market. What has not changed are the future earnings of those companies, thus the valuations of the stock market are, as they say, rich. A return to mean in interest rates or reduced quantative easing (tapering) will draw money out of the higher risk assets such as stocks. When stocks are richly valued, historically the return to mean is NOT gradual. Bear markets are much faster than the proceeding Bull market. So how does this effect the TSP Smart Investor models presented.
We expect the lower return obtained on the G fund or any money market account during the weak season to be more than offset during the reversion to mean (and below) valuations of the stock market during the weak season. In other words, during periods of rich stock market valuations, it is time to be more concerned about preservation of capital, than return on capital. We are not making a timing call on the next bear market here, the market continues to prove that it can remain over-valued or under-valued for extended periods of time. Bubble dynamics are also supported by current monetary policy or expectations of future monetary policy such as the realization that quantitative easing is becoming a permanent monetary-fiscal policy with accompanying financial-economic-political risk. But we do believe that the majority of the reversion to mean in stock valuations will take place during the weak season of the stock market and our seasonally-modified-buy & hold strategy will reduce market exposure during this time.
Invest smart.
Next... Strategic Risks
|
Figure 2. Comparison of Ulcer Index of Dow Jones Total Market Completion Index (S Fund Tracked Index)
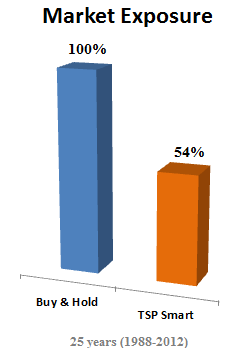
Figure 3. Comparison of Market Risk Exposure of Dow Jones Total Market Completion Index (S Fund Tracked Index)
Ulcer Index: An indicator developed by Peter G. Martin and Byron B. McCann that is used to measure the riskiness of investments such as securities, commodities, indexes or mutual funds. It is created by factoring in the depth and duration of drawdowns from recent peaks. A large UI value indicates that the security represents undue risk and an investor who holds it will likely need to wait longer for the investment's price to climb back to its recent highs. (Reference: Investopedia)
Market Risk: The possibility for an investor to experience losses due to factors that affect the overall performance of the financial markets. Market Risk, also called "systematic risk," cannot be eliminated through diversification, though it can be hedged against. Natural disasters, recessions, political turmoil, changes in interest rates are possible sources of market risk. (Reference: Investopedia)
|