


-
-
Seasonal Investing
-
-
-
Seasonal Investing - Seasonal Investment Strategy
Seasonal investing is all about taking advantage of the seasonal tendencies of the market or individual stocks or sectors.
I was not planning on building my own trading-day almanacs, but I decided I needed to see the data myself. They've evolved significantly as I gained insights into the seasonal patterns and the data sources. They help us understand why our seasonal strategy works but also enable investors to cherry-pick the best days and avoid the worst.
What are trading-day almanacs? They are a critical investing tool for serious investors. They enhance strategies and explain many of the stock movements. The data alone does not explain why stocks have tendencies, but they lead to questions of why. But the why does not always matter in investing. Just knowing what the seasonal tides are doing is important to increasing your winning percentages.
Trading-day almanacs differ from calendar-day almanacs in that they track movements based on what trading day of the month it is. The first trading day of the month may be the 1st calendar day or the 2nd or 3rd due to weekends and holidays. Using the calendar days skews the data. Trading day refines many seasonal effects.
Working manually with the data has lead me to ask additional questions and manually manipulate the data and discover true and false seasonal tendencies. This also helps develop better seasonal strategies to take advantage of those seasonal tides. If you know about seasonal tendencies and you are a serious investor are looking for a seasonal tool to add to your investor tool box, please jump to about our almanacs or sign-up for almanac access. If you are still learning, read on about seasonal investing...
...I spent many years researching investment strategies and investment newsletters for an easy to execute strategy that actually beats passive investing. As you may have heard, very few investment newsletters beat passive investing in the SP500 index over the long term. The long term is what matters to most investors who are not interested in speculating or following every market move.
What I found was many newsletters rose to the top during the bull market or for one year here or there. But what worked for them during a bull market failed miserably during bear markets. And avoiding the large losses that occur during bear markets is critical to building a large nest egg. What few retail investors seem to realize is that when the markets are richly valued as they are today, bear markets tend to give back all of the bull market gains on avearge in a very short period of time. The 2007-09 bear market gave back 120% of the bull market gains.
Another problem is if you look at the top 10 professional investment advisers, their investment strategies and methods could not be applied to retirement funds such as TSP, 401K and IRA accounts. They often used futures or sector specific index funds or individual stocks. This is not possible in most retirement plans, and I don't think it would be a good idea for typical investors.
After almost giving up on finding a strategy that beat buy and hold for retirement accounts, I stumbled across the concept of seasonal investing and found an award winning newsletter that had been successfully employing it. Since it only required two allocation changes a year, it definitely met my easy-to-execute objective. It is based on significant academic research and historical market data that shows (on average) most of the broad market gains occur in half the year. We will get to why later. First let's look at the effect.
Note: The following data is becoming dated, but the effects are still the same.
In the chart below we broke out how the small caps performed during what we call the favorable season (November - April) with a green line and the unfavorable season (May - October) with the red line. If you park your funds in an interest bearing account while out of equities, all the better.
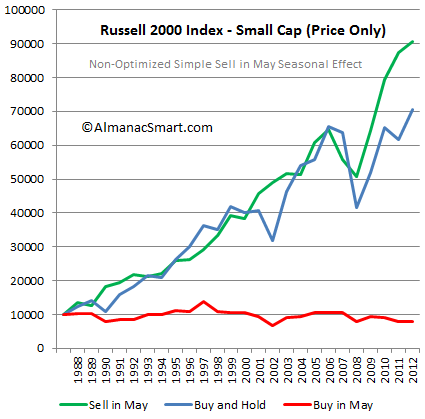
Figure 1. Chart compares 25 years of the Russell 2000 index to cumulative returns
of the strong and weak seasons represented by Sell in May (invested Oct - Apr)
and Buy in May (invested May - Nov)
"Sell in May" is not a new strategy. The saying has been around for 350 years! Yes 350 years starting in England's early stock market.
An investor's objectives are a bit different from an academician so I started doing my own research. The chart above is one of my early projects. I discovered the small cap funds (including the TSP S fund which invests in all the stocks not in the SP500 index) were the best candidates for seasonal strategies. Look at the red line. "Buy in May" shows what would happen to your account if you only held small cap stocks from May until the end of October. Consistently... not much.
In my research, I discovered Sy Harding. He had developed an advanced seasonal strategy that did better than assuming the market switched on and off at the turn-of-the-month in May and November. He adjusted the entry and exit dates and stayed with an advancing market before he sold or delayed buying if the market was going down. He traded the Dow Jones Industrial Average with great real-world results. Mark Hulbert of Financial Digest and Market Watch often wrote about his work.
I researched applying the strategy to the TSP fund's indexes - TSP C and S funds. The TSP C fund is the SP500 index fund and the TSP S fund invests in all the other US stocks so the "S" stands for small companies. I was able to improve on SY's work in several ways while keeping his simple to follow benefit.
So why is this the best investment strategy for TSP funds?
1. It works with popular SP500 index funds such as TSP C fund and SPY ETF and better with small cap funds such as the TSP S fund of VXF ETF.
2. It is easy to execute - only requires two allocation changes per year.
3. Over the full market cycle (bull and bear market), it has consistently beat buy & hope!
4. Investors reduce their market exposure by 50% by avoiding the weakest time of the year and earn interest in the off-season.
And remember very few market timers beat buy & hold, this is the only one I found that did and could be used by the typical investor. So why not just buy and hold and not worry about a few percentages? Because when the stock market is richly valued, future returns are always the lowest. You will need to avoid some losses in order to produce positive returns over the next decade or so. In other words, buy and hold looks great near market tops - it does not look so smart as the market bottoms.
Market Risk: The possibility for an investor to experience losses due to factors that affect the overall performance of the financial markets. Market Risk, also called "systematic risk," cannot be eliminated through diversification, though it can be hedged against. Natural disasters, recessions, political turmoil, changes in interest rates are possible sources of market risk.
In the Investopedia definition of market risk we agree that market risk can not be eliminated through diversification nor can it be hedged against in most retirement accounts. For the average investor hedging is not a realistic strategy and it is simply not possible with self-managed investment accounts such as the government's Thrift Savings Plan and many 401K plans. It also comes with a cost.
After building on Sy Harding's award winning strategy, we developed our own strategy and named it the Seasonally-Modified Buy & Hold strategy. As you will see it has worked quite well over several full market cycles (Bull and Bear markets) - again with only two allocation changes per year. A large part of its success is by how it performs during bear markets. The table below compares buy & hold to the TSP S fund using a simple seasonal strategy.
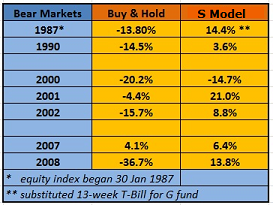
Figure 2. Bear market performance of a seasonal strategy
It is surprising to many investors how large an influence the seasons have on the financial markets, yet commodity traders take this factor for granted. Most of the economic data reported has already been seasonally adjusted. So why wouldn't the stock market have its own seasonal fluctuations.
How does it work?
The goal of the seasonal strategy is to take advantage of the seasonal patterns of the U.S. stock market by allocating to equities during the strong season (loosely defined as Fall and Winter) and into low risk interest bearing asset such as the TSP G Fund during the weak season (loosely defined as Spring and Summer).
An important objective of the strategy is determining the two dates each year to re-allocate funds since the optimum dates differ each year. The strategy does this by focusing on the trend of the market during seasonal investment windows. Following the TSP Smart seasonal timing strategy (Orange) using the TSP S Fund significantly beat a buy and hold strategy as seen in blue while being invested only 6 months per year.
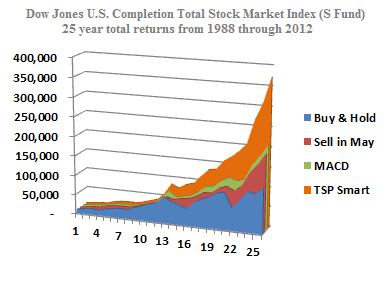
Figure 3. Progression of seasonal models from simple to optimized.
The S Fund performance seen in figure 3 shows the evolution in models from Buy-and-Hold (Blue), Sell-in-May (Red), a non-optimized market trend indicator (MACD) using investment windows (Green), and finally using our TSP S fund optimized market trend indicator.
This simple exercise provides evidence to the robustness of applying seasonal strategies over full market cycles of the stock market. While it is certain the total returns of any strategy, to include Buy-and-Hold, will not repeat exactly; seasonal strategies present strong historical evidence that they will beat the indexes over full market cycles (peak-to-peak, or trough-to-trough). An optimized model should continue to beat a Sell-in-May strategy which in-turn consistently beats a buy and hold strategy.
What makes it different?
Unlike pure technical or fundamental analysis, this strategy starts with a seasonal filter as its foundation. The strategy simply wants to be out of the market during the historically weak season regardless of economic predictions, current news, or analyst predictions. This takes the emotion out of allocation decisions and applies an evidence-based solution to our allocations.
Within seasonal investment windows, we use a simple trend deviation indicator created by Geral Appel in the late 1970s called the Moving Average Convergence Divergence (MACD) as seen in Figure 4. Sy Harding was the first to apply the MACD to the DJIA to create timing signals for his seasonal strategy. The MACD indicator is used to spot changes in strength, direction, momentum, and duration of a trend in a stock’s price. The indicator can be found on most charting software or online charting services with default variables that can be modified.
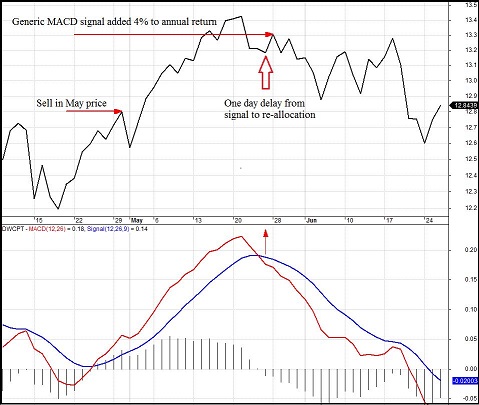
Figure 4. Adding the MACD indicator to refine Sell signals
We focused on the TSP US equity index funds to develop models and obtain the optimal risk-adjusted return over a full market cycle. Using signals generated from Sy's DJIA did not provide the best timing signal for the C fund and S fund.
Also, the MACD trend indicator was not meant to be used with the default settings found on charting programs as we observe some analyst doing. The MACD variables were designed to be optimized to the asset being analyzed.
There is also the issue of the delay in requesting a TSP allocation change after a signal is generated. We took this into consideration in optimizing our timing signals. This delay is similar to many mutual funds so it is not unique to TSP. Since the indicator is based off closing index values, the earliest one could re-allocate would be at the closing value of a fund on the next trading day.
Simply put, our timing signals are designed for us to have time to execute the allocation change.
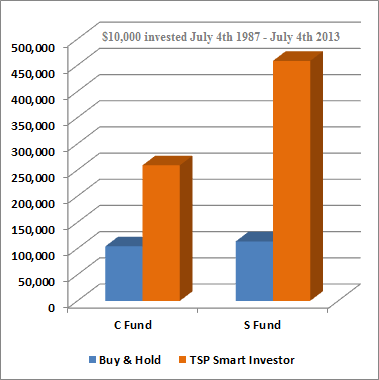
Figure 5. Small Capitalization Funds (S Fund) have greater
seasonal tendencies than the S&P 500 (C Fund) but both benefit
Another unique method used in our model development was the use of trading days vices calendar days to better understand seasonal patterns. Initially we used calendar days similar to other research, but this is not congruent with what we know about seasonal tendencies. When we altered our model-development programs to use trading days, as well as account for the delay involved in re-allocating TSP funds after a signal we increased the fidelity of our models and ensured more robust timing models.
Calendar days verses Trading Days: Many of the drivers of seasonal tendencies are based on calendar events, such as the automatic end-of-month paycheck deposits into retirement accounts. But if the end-of-month day is a Saturday, then the investment money does not begin flowing until the next Monday which might be the 3rd of the month. In this case, the 3rd of the month would be the first trading day and Tuesday would be the second trading day of the month. By analyzing the trading days of the month we are better able to see the influence of the end-of-month effects. By focusing on calendar days, the results would be skewed since each year is different.
We provide a whole market timing signal called Advantage W for the most diversified portfolio. During later research we found the total US stock market using the same strategy provided the best timing signal for the TSP C and S fund than the individual funds did for themselves. This discovery allowed us to send only one Bellwether timing signal for all of the funds we track. It makes sense the total US stock market would provide the best indicator to when the favorable and unfavorable season for equities begins and ends.
The TSP Smart Investor & Vanguard Smart Investor Advantage models incorporated over 60 years of the S&P 500 daily price history, over 25 years of the Dow Jones U.S. Total Market and Total Market Completion Index (C and S Fund adjusted for dividends) and numerous seasonal studies. The models were run over a thousand times to cull out the optimal dates and variables during different time frames. Our Advantage models are rooted in history and are simple to execute which is what we feel makes them ...well ...smart.
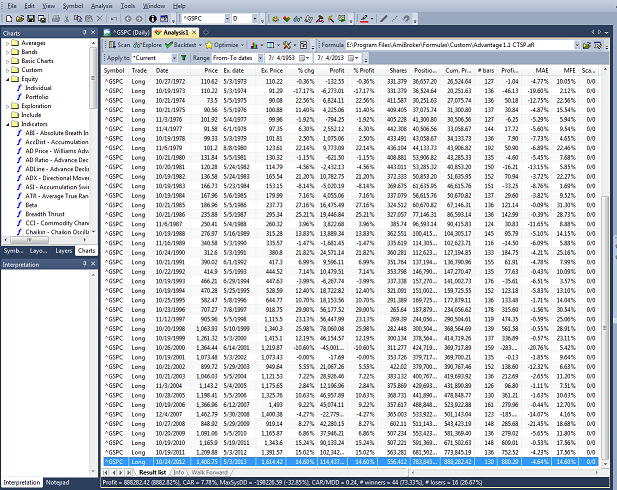
Figure 6. Screenshot of modeling program used to analyze strategie
Well designed seasonal strategies offer the benefits of a buy and hold strategy without all the market risk, and with the added weak season benefit of earning the risk-free return in money market type accounts or TSP G Funds.
If the results of this strategy were not so compelling I would not have started a low cost timing service. I have found there are a lot of what I call reluctant TSP investors - not interested in finance, but you have to make allocation decisions. So I offer a no frills, low cost service to help with applying what I found was the best investment strategy for long-term investors. I hope you take a look.
Learn about our service or about our levels of service to keep your funds safe or more about me.
Invest safe, invest smart.