

-
-
-
-
-
-
Why I am Defensive
-
-
-
-
Why I am Defensive
And You Should Be Too
I am constantly amazed at the amount of commentary that regurgitates academic theories, models and marketing but completely ignores the real-world data and trends. My goal is to show you the historical data and trends.
Being defensive in investing means allocating less to stocks than in normal times and being a little paranoid when indicators turn south - meaning getting out of the markets and giving up some potential gains to avoid taking large losses.
My advice stands in contrast to those who say buy and hold no matter what. The problem they say is timing... and they are correct. Timing is hard and made more difficult by central banks that step in to save the markets every time the markets try to correct to reasonable valuations. So I am not going to have a discussion on timing, but a discussion on potential outcomes to your investments from this point in history.
Past Returns and Future Returns
When are past returns the highest? You know, those 3, 5, and 10-year returns you find printed everywhere. And when are future returns the lowest?
The answer, of course, are at market tops. I am not saying we hit a market top yet because unfortunately the drivers of this market are still in place (and that is not a good thing). But we may have.
Analyst tend to agree that there are two types of market cycles - cyclical and secular. Cyclical cycles last 4 -10 years. The current bull market which started in 2009 could become the longest cyclical bull market in history soon. Secular market cycles last 20 - 40 years and are defined as a series of cyclical bull markets where each cyclical bull market peak ends with a higher valuation (and price). Then a secular bear market occurs where each cyclical peak and trough have lower relative values relative - relative earnings being the most popular measure.
The current market measured by many valuation methods has exceeded the 1929 and 2000 extreme (bubble) market tops. Based on this, I would say it is safe to say we are playing the end-game the final cyclical bull market in a long secular bull market - an extreme peak and global bubble.
I spend a lot of time discussing how we got to this point in history in my reports and talking points. The short answer is it took a lot of manipulation by the experts - emergency post-crisis monetary policy, financial engineering, accounting engineering and of course wall street favorable fiscal policies. I would add a lot of mis-information and ignorance to the equation since investor sentiment remains sky high - another requirement for a market top.
Market Valuations
While there are others who discuss valuations, I enjoy Dr. Hussman's discussions, trials and tribulations the most. He is an economist trying to run his own mutual funds and like many other analyst has struggled with this bull market. Not to jump ahead, but since this market cycle is unlike any other it has made a mess of many tried and true market strategies. I think Dr. Hussman has improved his strategy, but has not fully discussed the primary driver of this market in his commentary. But I still like his discussions and his valuation models.
I present this model first because the data goes back to the 1920s and shows how the current market stacks up to the 1929 market and crash that was part and parcel to the great depression. Remember, this chart plots valuations and not price levels. The valuation is relative to margin-adjusted 10-year averaged earnings which is a more stable denominator than annual earnings or the ridiculous estimates of forward earnings published by market salesmen analyst.
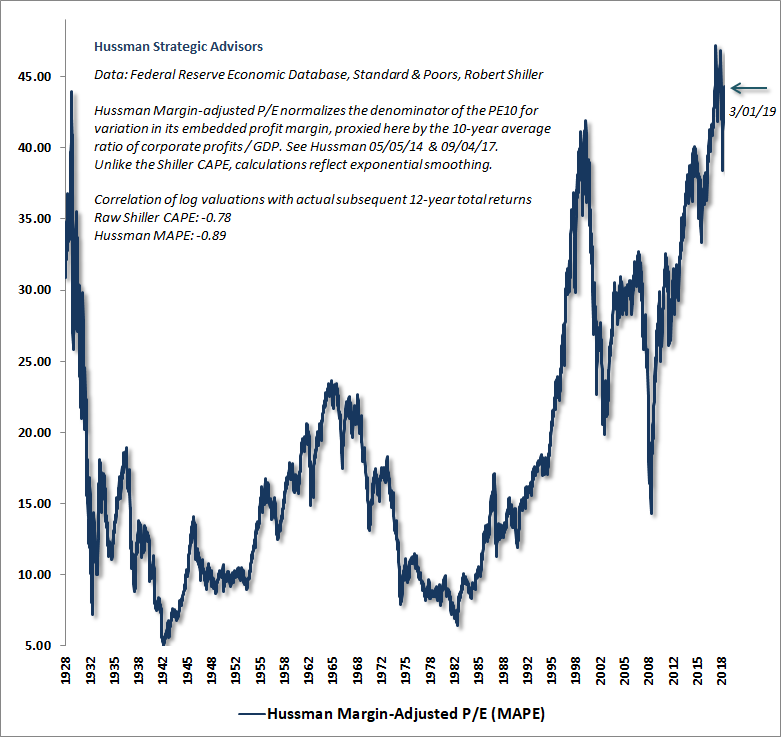
That 1965 peak was a richly valued secular bull market peak. It should make you a little nervous that today's stock market would have to lose 50% in terms of valuations just to come down to the last secular bull market's peak! And down 60% to return to the HIGHEST bear market trough in history (2009).
So back to my point about future outcomes. Do you think there is more upside or downside built into the markets today.
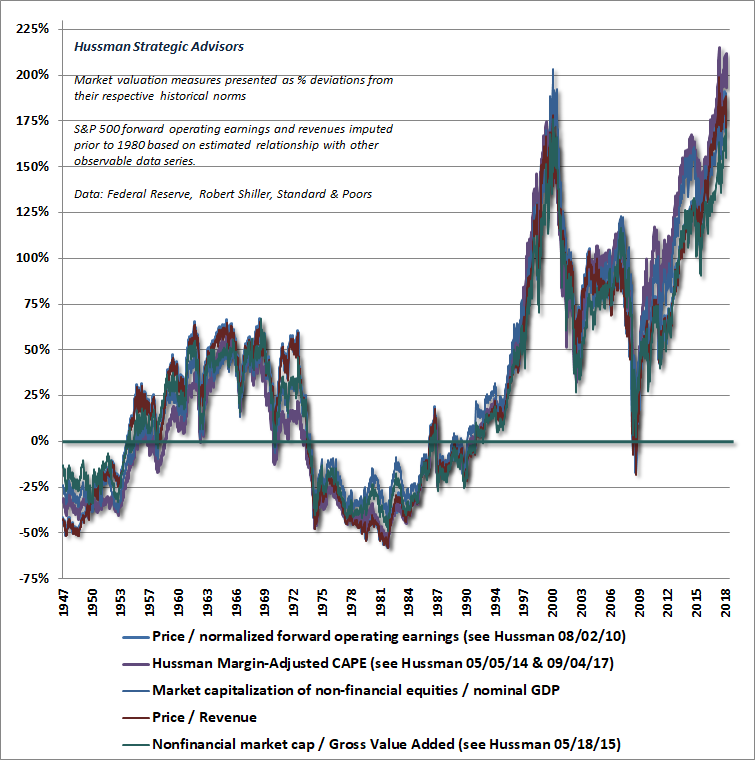
We've only looked at one measure of valuations. Let's look at few others Dr. Hussman tracks. Ditto, ditto, ditto, and ditto on the market extreme. And they are not all based on profits. Understand the financial media base their comparisons on where we were last year, not historically. They always find an excuse to explain why the market is going up and why the market will go up. And 80% of the time the market will go up. It is that other 20% that can destroy 10 years of gains in a very short order that you need to start worrying about.
Real wealth is generated by growing future cash flow and earnings not balance sheets. That requires investments in the economy. What we have seen this cycle is simply a balance sheet expansion (to include your retirement statement) with little growth in sustainable future cash flows nationally. Hence high valuations.
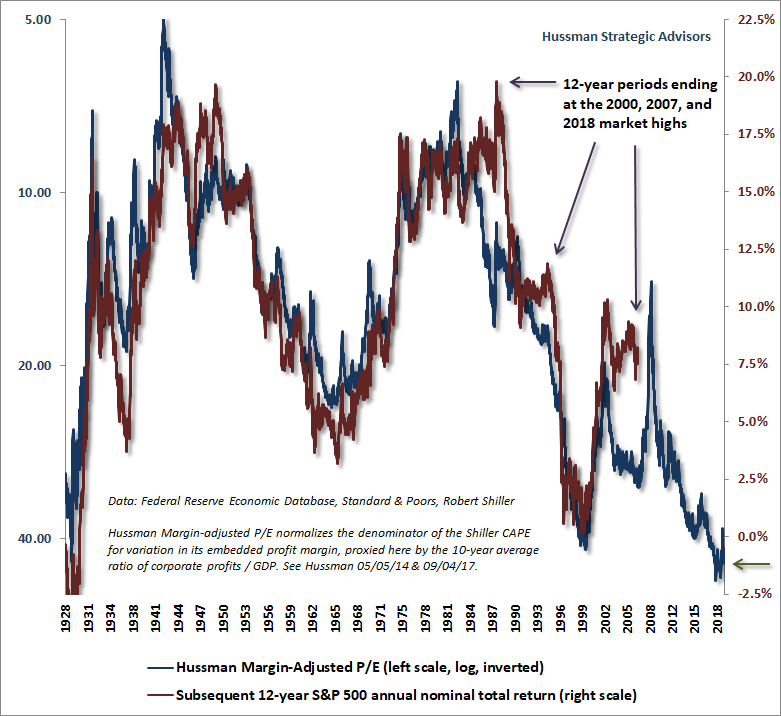
It is important to understand market valuations have little correlation to market returns over the next year or two. These models were designed to predict annualized returns over the next 10-12 years based on current metrics. They are highly correlated to long-term future returns. This next chart shows how the model worked out 12 years later (red plot) since 1928. The two deviations show the effects of market bubbles 12 years later (2000 and today). The current deviation (bubble) means we will have some catching down to do in the near future. The model is pointing to negative TOTAL returns annualized over the next 12 years as of March 2019. Most of the damage will come fast and furious at some point in time.
Something is going to break soon
I am going to jump from the stock market discussion to another little issue that needs to be understood before any discussion on the policies can get underway. Because if commentators or analyst do not explain this situation is happening today and is accelerating, then you should not listen to them. I am not saying I have all the answers, some maybe, but I have lots of questions that are not answered by politicians or policy setters.
Why this matters is because I believe we have experienced the "weakest economic recovery in 100 years" because the constraint to growth has been on the demand side of the equation - the consumers, the 90% and not on the supply-side. Although the supply-side could have done more with the right policies in place.
So my first question is "WTF happened?"
I added a few comments to the next chart that I think explains a lot of what happened. Not all of it, but a lot.
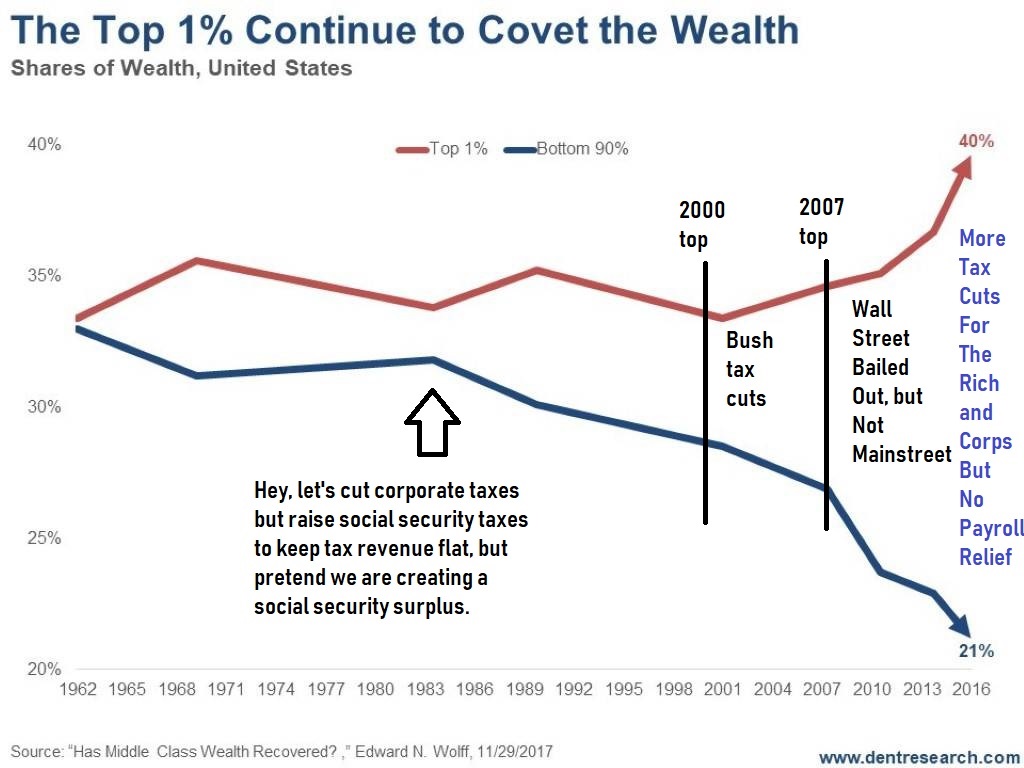
The scary part is this chart ends before the Trump cuts. Not only did the recent tax policy do little for the demand side of the economy, they now want to partially pay for those permanent tax cuts for the rich by cutting spending that will come directly out of the demand side of our economy.
So glad the top 0.01% got a big tax break...
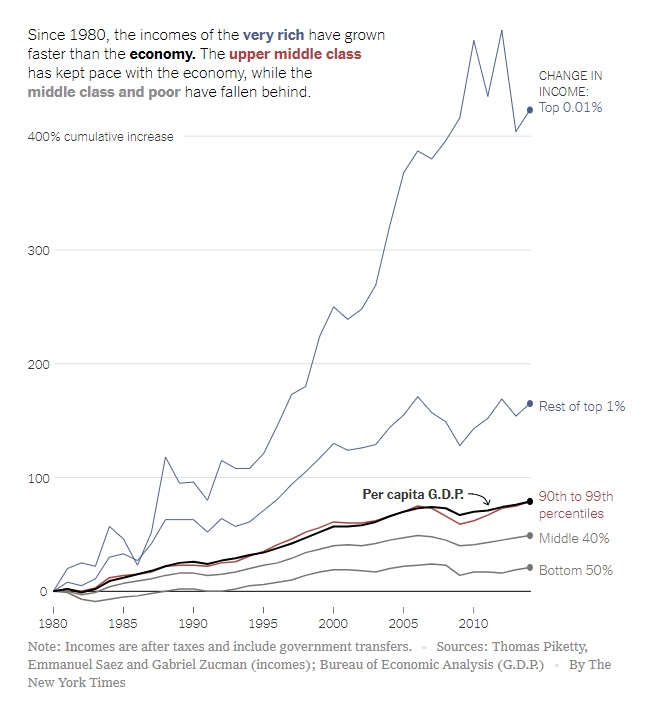
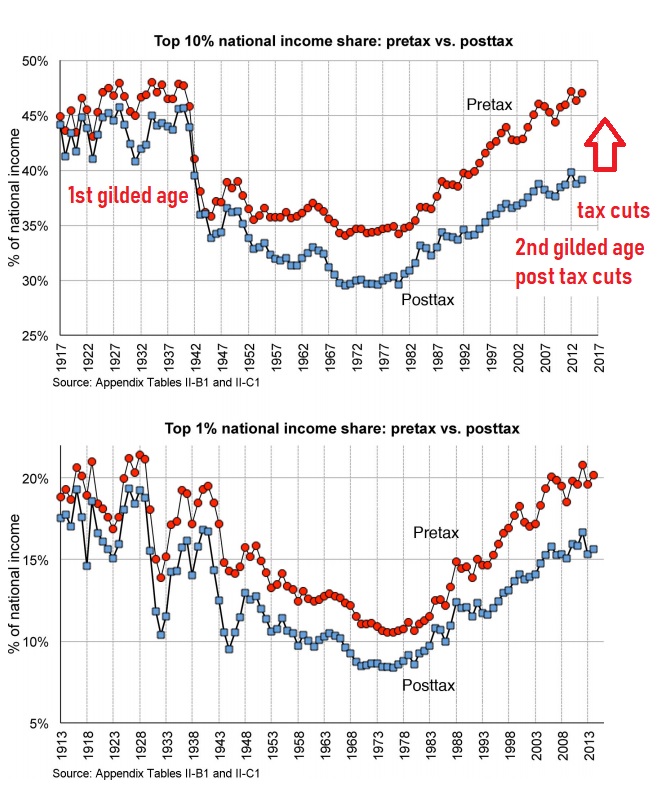
So where is our current policy taking us - the second gilded age. I'm not kidding. They just needed to reduce the taxes on the top 10% to complete the sequel.
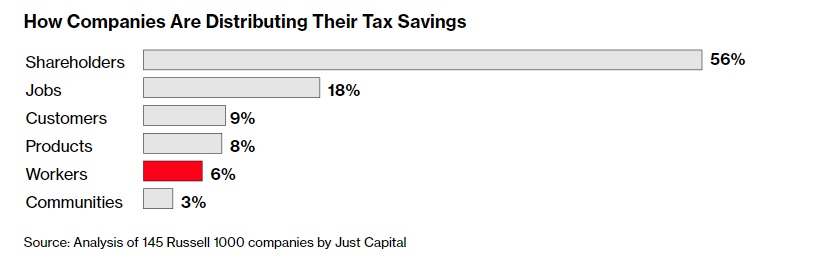
There will be little economic growth from the tax cuts because there is going to be little increase in economic investment. Historically the highest investment in capital production took place when the wealthy needed to find tax deductions to avoid handing over their wealth to Uncle Sam. With low taxes, they simply hoard and complain of the lack of DEMAND. There is more to it, but our policies do not force investment in US and it shows.
So What's Going to Break
At some point the financial system will break down again. What we are seeing this market cycle is massive central bank interventions that have driven a profitless bull market in the stock market, the bond market and the real estate markets. "Profitless" from the point of view of the real corporation earnings, not speculative profits in riding the financial asset prices up. GAAP corporate profits have been flat since 2012. Don't confuse this with what is reported to investors. There are a lot of games going on. Too many at the same time.
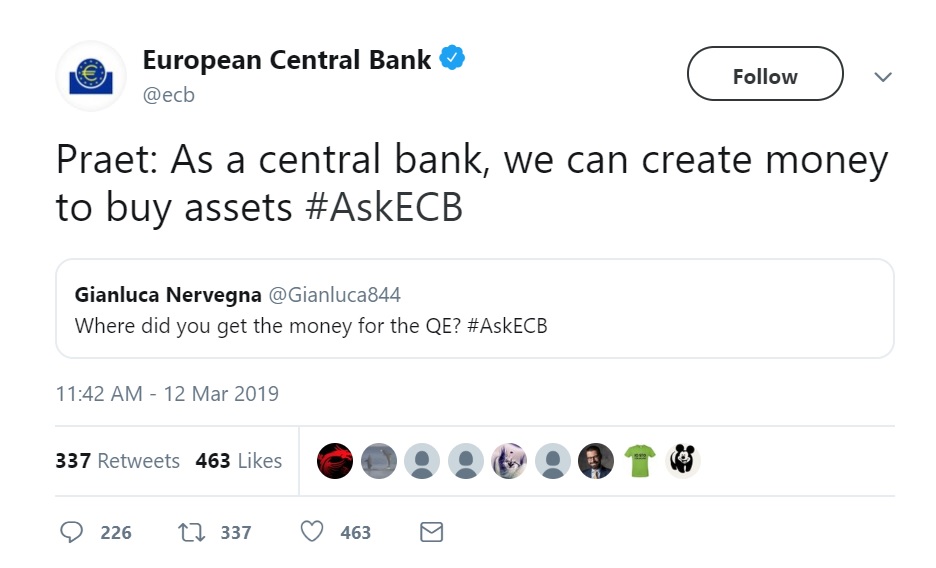
The central banks have been printing and buying financial assets globally keeping the stock and bond markets in a bull market (see ECB tweet below). THIS is the driver of this bull market. And so they will continue to try to do this and they may succeed one more time. But if the market does not break first, politics will do it later. I not only expect a complete reversal in policy, I encourage it.
So What Does This Mean to Your Investments
The only way to make a high return over the next 12 years is to miss the carnage and reinvest when market valuations have reset and market internals tell us the bottom is in. It could be awhile. And there may be times to jump back in for short gains. But buy & hold is a very HIGH RISK strategy at this point in history.
The charts and ideas above are just the starting point for understanding where we are relative to history. Consider it a frame of reference. Most investors have no frame of reference other than looking at past returns presented in marketing.
My goal is to help reluctant and serious investors become more aware of the investing environment so you can make more informed decisions. Knowing where we are in history is a start even if you are not a member. I offer a free blog if you are interested. And you can review other free guides and posts on my investor dashboard to include the Best TSP Allocation in 2019.
ABOUT OUR Market Warnings...
...they can be helpful in avoiding losses:
our 18 August 2015 interim update warned ...
Market internals remain weak and have for some time. Aversion to risk as measured by credit spreads in the bond market have now reached levels that historically been met with significant market corrections ... in the stock market within weeks.
Note: Our models were already out of stocks in August but we sent the email alert as advertised.
our members avoided significant losses...
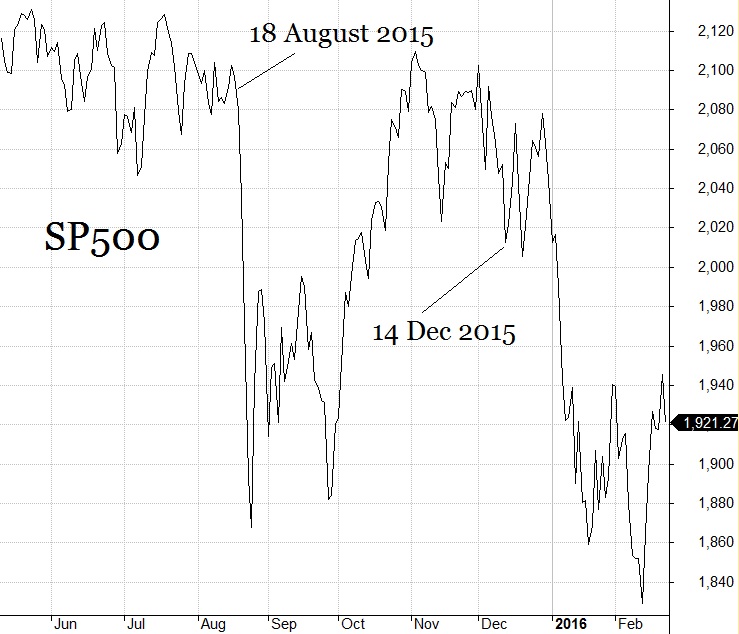
again in our 14 December 2015 Special Timing Report we warned...
...our risk aversion indicators are indicating a potential market crash anytime in the next few weeks...
the next alert and warning did not occur until early 2018:
on 30 January 2018 via email alert...
I am reducing our allocation level to 50% in my subjective timing model on 31 January 2018.
Discussion: Our risk indicator remains in the Safe Zone. Stock market internals are fine, so why the shift?
Parabolic moves in the stock market are not normal and once they stop advancing everyone's technical signals
quickly reverse and then selling creates a negative feedback loop.
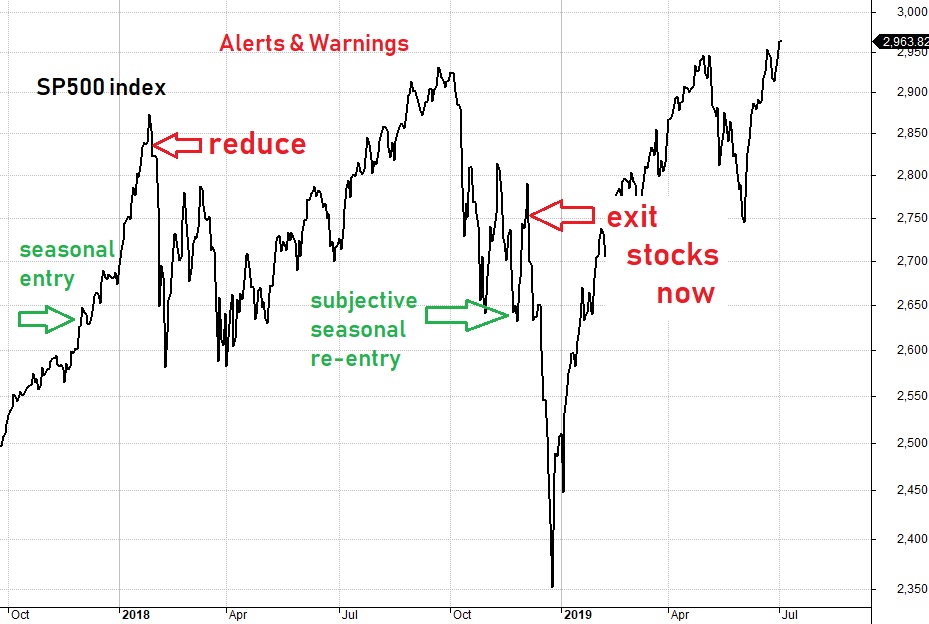
The last warning in 2018 came shortly after our objective timing model entered stocks. While December is usually the strongest month for the stock market, we saw risk-sensitive bond investors running for the exits which typically leads sell offs in the stock market. We sent the warning out to exit equities prior to the deeper crash. My view remains the market would have plunged much deeper had the Treasury Secretary not intervened in the markets which sparked the record setting rally on the back of no fundamental improvement in the corporate performance.
The media sees every price movement as caused by current events as reported in the news. The market went up today because of the XYZ positive event. If the market had gone down that same day, it would have been because of the ABC event even though XYZ happened too. They have to have a surface level news event for market moves.
You can follow part of the discussion on our free TSP & Vanguard Smart Investor blog and you can review a lot of free posts on our website's Dashboard. My goal is to know what is driving this bull market so I know when it will end... and it is not what they taught us in finance in college.
At some point, I hope you join us where you can become a member for only $75 annually for the ongoing discussion of what is going on in the markets and for those market warnings.
And consider what missing those market plunges would have saved you versus our cost.
Invest smart,
Michael Bond