

-
-
-
-
Our Results
-
Bellwether Timing Signal
Evolution of the Bellwether timing signal
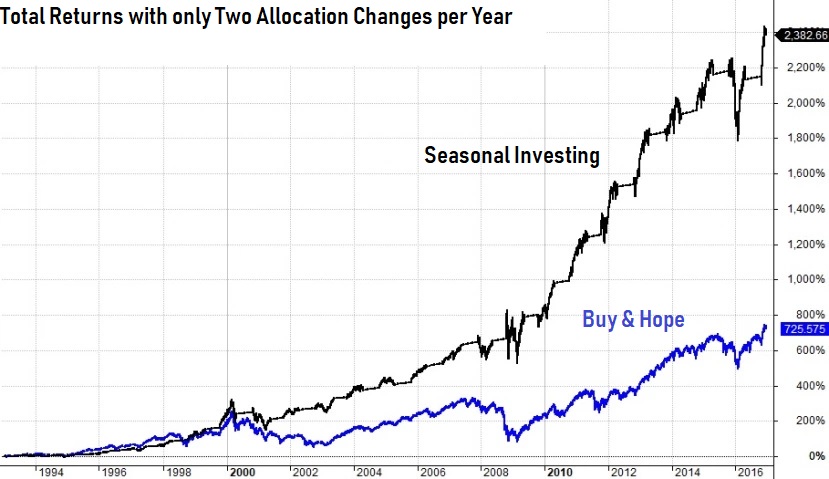
One of the first questions I get is "if seasonal strategies work so great why haven't I heard about them before and why isn't everyone following them". A lot of people do follow them or take the seasonal tendencies of the market into account, but it is not pushed by mainstream financial advisers for two main reasons: 1) they lose fees if you are invested only half the year and 2) they do not understand or what to understand the strategy in-depth. There is also a lot of lazy analysis on the subject that does seasonal investing a disservice. But look at the results.
The dotted blue line below represents the gains of the SP500 index since the 2000 market top. It pails into comparison of the seasonal strategy that managed to avoid most of the two bear market losses while capturing most of the market's gains.
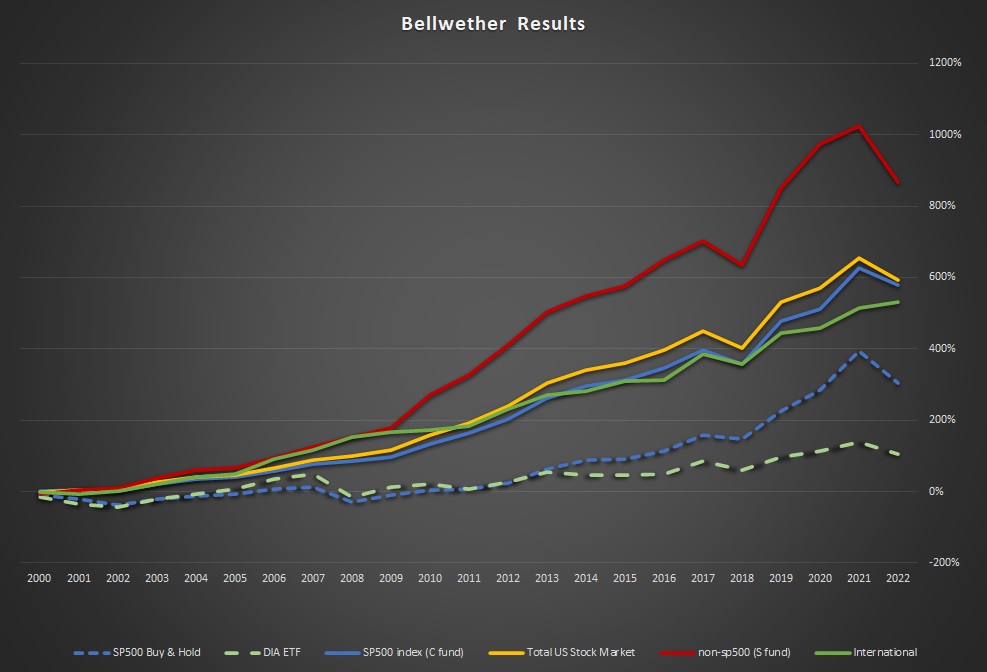
You can see more charts on the Bellwether Results page. This page explains the evolution of the current timing signal.
The Bellwether Timing Signal
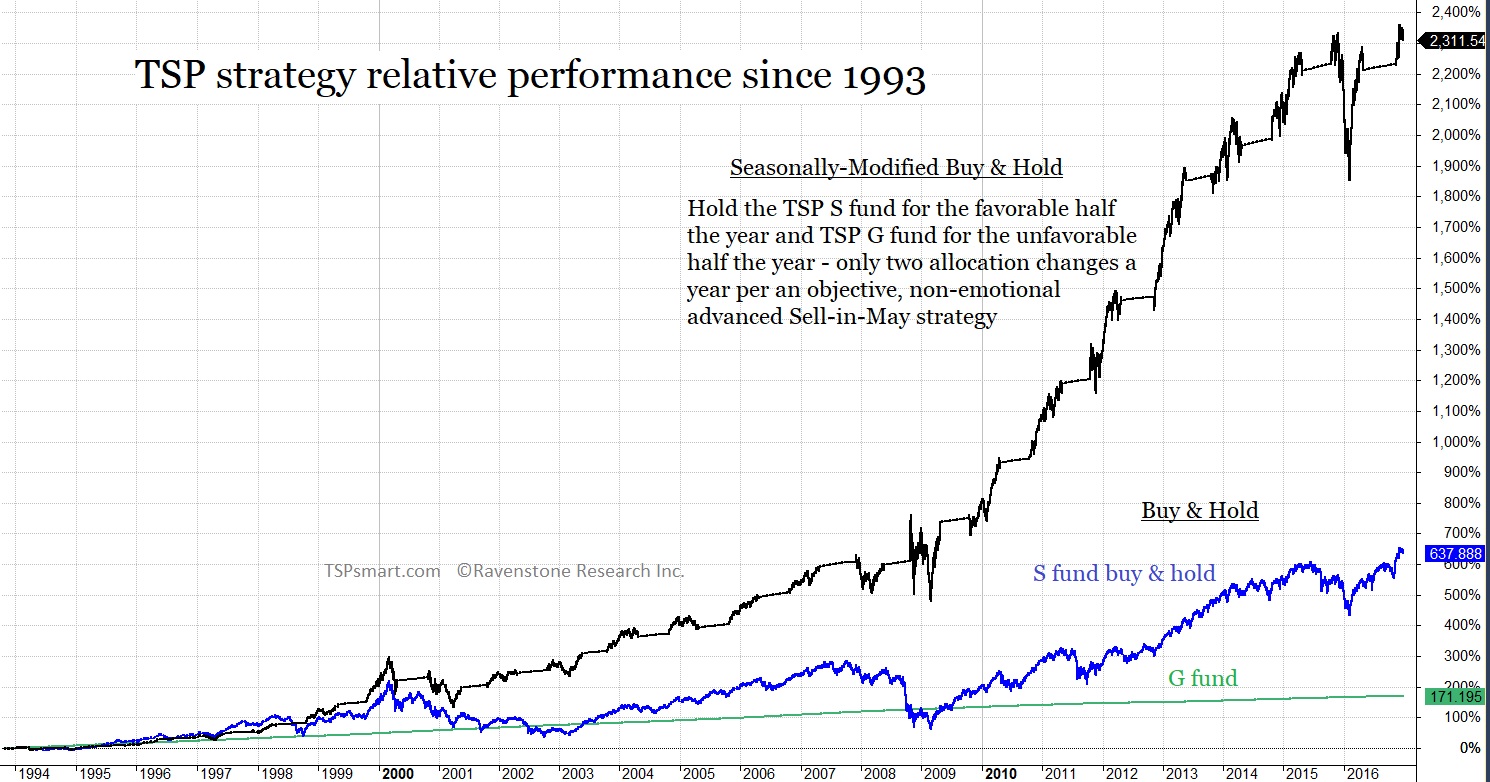
The Bellwether Timing Signal provides two timing signals per year for a Seasonally-Modified Buy & Hold Strategy. Our seasonal strategy evolved out of Sy Harding’s award winning seasonal timing strategy (STS). Sy’s simple strategy was to only invest in stocks during the “favorable” season and sit in safe interest-earning investments during the “unfavorable” season. Unlike market timing based on technical indicators that can issue buy or sells at anytime, this strategy buys and holds but only in the strongest months of the year for stocks as evident in the chart below.
Common sense will tell you the favorable season does not precisely begin with November nor end with May as a simple Sell-in-May strategy would have you do. The reason these dates are so often used is simply because the monthly returns of the markets are readily available and it is easy to analyze. The lazy man analysis does a disservice to the seasonal aspects of the stock market. Think about it, almost every economic indicator is seasonally adjusted. Commodity traders and farmers hedge based on seasonal price changes and stocks show a seasonal price progression when we average decades of data. Sy Harding found that trading at the turn-of-the-month left gains on the table. Some years more than others. So he developed a better way to determine the start of each season for the stock market with great success.

Sy used an "investment window" to start looking at a market momentum indicator to both enter and exit the market. Simply put, if the market was in an uptrend in the Spring he would not Sell until the market turned down based on a MACD technical indicator. He reversed this logic in the Fall. His strategy was a historically-informed objective-based strategy that eliminated emotional decision making. He even had to admit it beat his own technical calls in the long run.
.jpg)
The Best Strategy for Retirement Accounts
I was looking for a strategy that could beat buy and hold over the long run and could be used in the government's version of a self-managed 401K plan called the Thrift Savings Plan (TSP). It needed to be simple-to-execute with few allocation changes. After looking at all the top long-term timers and their strategies as ranked by Mark Hulbert's Financial Digest, the seasonal strategy was the only one that met my objectives, period. Sy had written a book about his strategy and I began my own research to first mimic, improve it and optimized it for the SP500 and small cap funds.
Sy used the Dow Jones Industrial Averages to provide signals and track returns. He used T-bills as his benchmark return when out of stocks. He recommended his signal for the entire US stock market. I found it was not an efficient signal for the SP500 index or Small Cap funds. I also scratched my head over why he used the default setting for the MACD indicator to make buy and sell decisions instead of optimizing the indicator to the DOW as it was meant to be used. Yet his strategy beat passive investing with a lot less stress during bear markets.
Optimized to the funds we invest in
I made three important adjustments to Sy’s STS. First, I used the actual funds we invest in – the SP500 index (TSP C fund) and the non-sp500 small cap index (TSP S fund) as well as the Russell 2000 and the total US stock market. With the passing of Sy Harding, I added the DIA ETF which tracks the DOW. I also still track his original strategy's performance.
Second, I optimized the MACD to both the buying and selling of each fund. Third, we found the best investment window based on the other variables. Our small cap and large cap window ended up being only one day apart, but our window is about two weeks later than Sy’s sell window. The improvements can be seen in the next chart. Starting in 1988 and not including the 1987 market crash which would have made the seasonal strategies look even better, we see the simple sell in May strategy beats passive investing. Sy's signal was not optimized fro small caps, but still improved on sell in May. Our optimization is seen in orange.

I ended up with five optimized timing models we called the Advantage Timing Models.
The problem we ran into was we ended up with five timing signals all coming in within days or weeks of each other. Our simple strategy became confusing to those wanting an easy to follow service.
A few years later I found one signal that did work for all the funds - we named it the Bellwether Timing Signal. Using the Total US Stock Market to determine the change of seasons for our Seasonally-Modified Buy & Hold strategy improved the performance of timing the SP500 index fund and the DIA ETF as well as matching the performance of the small cap funds over the long run. It was a no-brainer to switch all our models to one signal and greatly simplify our service.
If you think about it, it makes sense. We are looking for the turning of the favorable and unfavorable season for the stock market, so why won’t the total market make the best signal. The DOW used by Sy had only 30 companies - Sy did not have a way of using the total market in the late 90s for his research. The reason I believe Sy used the DOW instead of the SP500 index was that it had greater seasonal tendencies than the SP500.
The total stock market is predominately the SP500 with the small caps added on. Since the small caps often turn up or down first; this extra influence improved the results over the SP500 signal alone. The small cap signal by itself produced more false signals due to its volatility so adding the stability of the large caps eliminated the noise.
Not each year, but over the long run the Bellwether signal provides the most profitable and easy to follow timing signal for all the funds. It works especially well for small cap funds like the TSP S fund or Vanguard VXF ETF as seen below.
Avoid stocks in the unfavorable season
Please note that our strategy only requires two allocation changes per year in order to avoid the unfavorable half of the year for stocks. It is an advanced Sell-in-May strategy built off the work of Sy Harding and optimized for any SP500 index funds and small cap funds (TSP C and S fund). To learn more about the timing signal, please review Bellwether's Timing Signal.
Bellwether increases returns by reducing risk, not increasing risk
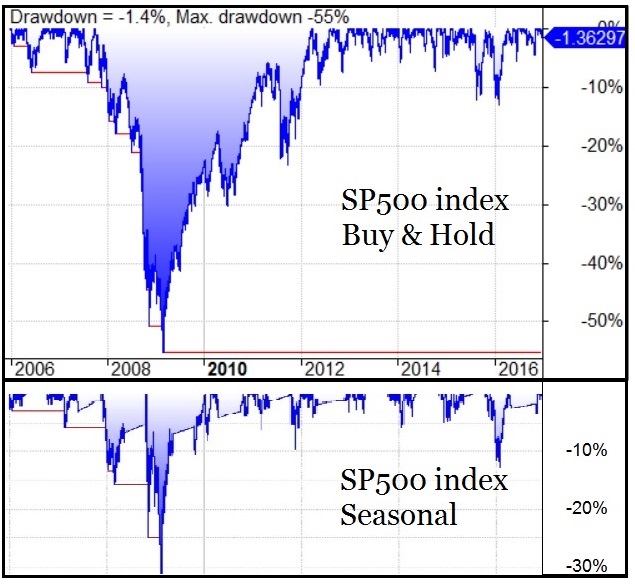
The chart above only shows the draw downs of the market following a buy and hold strategy and a seasonal strategy. From this perspective, we can see seasonal investing reduces investor stress levels along with providing higher long term returns. There have been two bear markets like the one seen above since 2000. We are due for another bear market. Are you ready?
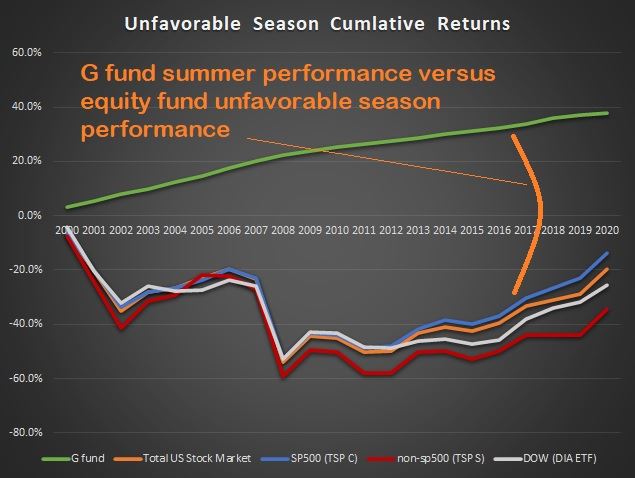
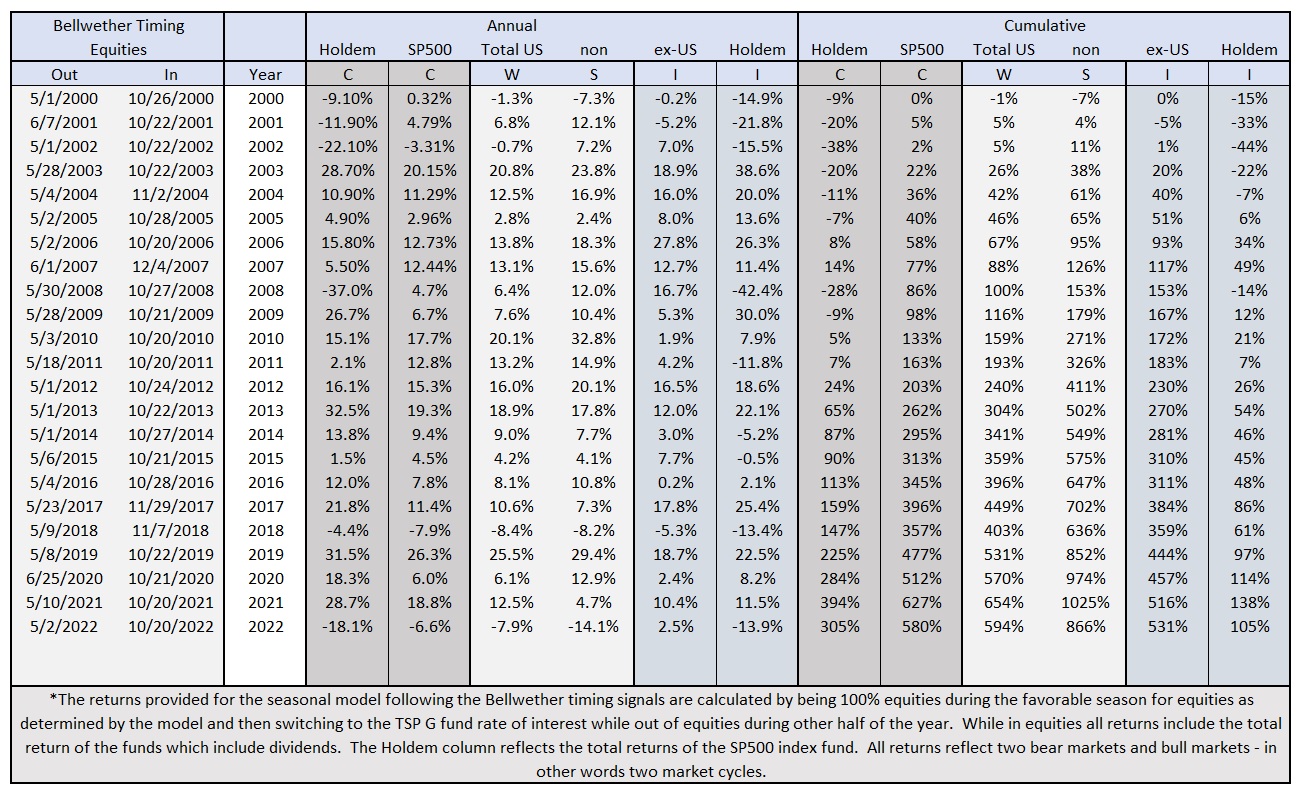
The Details
What you see below shows what happens to your long term returns when you avoid taking the large losses that historically hit the market during the summer and fall. The chart below have the individual year returns and the cumulative returns since 2000 using this simple-to-execute strategy. The bottom-line is that following our Bellwether timing signal increased the SP500 index funds return from 147% to 362% total return since the beginning of 2000. The small cap funds do better thanks to their larger seasonal volatility.
The Bellwether Results
our Seasonal Strategy
our market commentary
get our email alerts prior to market crashes