


-
-
-
-
-
Improving your returns
-
-
-
-
-
-
The Smart Investor Allocation Guide
Improving your Returns
How can I improve the returns of my core retirement funds?
Before we get to improving your returns and avoiding risk, I want readers to understand the following are my opinions. You will find plenty who disagree with me especially from those whose incomes are affected by how and where you invest. While I charge a small fee for my service, my income is not affected by which brokerage you park your money with, which company's funds you choose to invest in, or whether you sit in cash the rest of your life. I have no relationship with TSP or Vanguard or any other financial service company. I do not accept advertising money since I can not stand looking at popup dancing website advertising myself.
My fees are smaller than some brokerage commission charge to merely move your fund from a mutual fund to cash. If you are in one of these brokerages, my opinion is you should move your money somewhere else. For those of you with TSP accounts, beware of those trying to get you to transfer your money into another brokerage when you retire to "give you more options". Know their long term record and their expenses before you do, and understand the benefits of the G fund that no other financial service can offer.
My goal is to help you make more informed decisions. I believe anyone can beat most paid money managers. For many, you have been forced to make investment decisions since TSP or 401K plan requires you to make them to manage your account while you are still working. You can do it. You may find it is simpler than you thought.
Buy and Hope no longer works
My most basic opinion is you should not set and leave your allocation levels until your retire. I know many have done this and since we have been in a bull market since 2009 your accounts have grown larger and so now you begin to worry because you have more to lose. This is a good thing to have to worry about. Hopefully we can help others have this same problem while we help you keep this problem. In this one chart, we can see why buy & hold in the stock market has not worked since 2000.
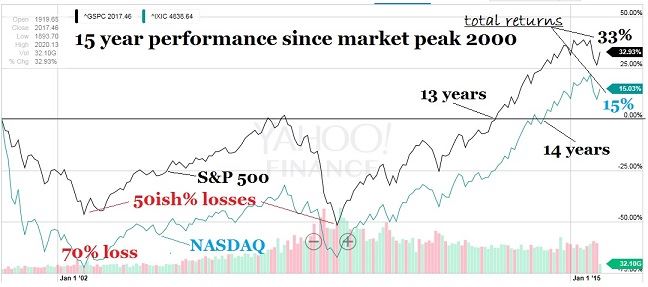
The black plot is the performance of the S&P 500 index (TSP C fund tracks this index) since the market top in 2000. The S&P 500 represents 80% of the value of the total US stock market and that value has been cut in half twice since 2000. The NASDAQ index lost over 70% after the tech bubble crash. After 15 years, the total return of a buy & hold S&P 500 investor is only 33% (October 2015).
Update (October 2019): The year 2015 WAS a bull market top that got a central bank extension thanks to $4 trillion in money printing and financial asset buying in 2016 alone. That extension took us to 2018-19 where the market is struggling. Consider that gross corporate profits prior to taxes have not grown since 2012 which means stocks have primarily moved higher in price by becoming more expensive relative to many measures.
I hope your main take away from the chart is the market has experienced several significant bull (up) and bear (down) market cycles and the money you invest in equity funds are on this roller coaster. If you stayed on the roller coaster during the bear markets that started in 2000 and 2007, you can see you earned 33% in capital appreciation plus dividends since 2000 by 2015. The only gains you made in the first 13 years where from dividends paid by the stocks within the indexes. Dividends are important, but presently the dividend yield is low and the potential for losses is large. Those two bear markets took less than 2 years to wipe half the value of the market out. As you will see in the next graph - beware of bears.

Many charts and tables of returns are very misleading since comparing losses to gains is not straight forward. If one sustains a 50% loss the 1st year and then gains 50% the next year you did NOT breakeven in the two years - you are still down 25%. This is because in the second year you only had half the funds that you had invested the first year. I created the chart above to try to make this point stand out about the last two bear markets. Instead of showing losses it shows the gains required to just breakeven. So not only did it take a Buy & Hold investor 13 years to breakeven from the last bear market, they had to gain 110% during this time.
When it comes to avoiding losses in the index tracking funds, it should be obvious in the chart that avoiding the bear markets would go a long way to boosting your retirement funds. Many burned investors stay out of the market during much of the bull market only to jump back in near the top. The objective is not just to avoid most of the losses in the bear market, but to also capture most of the gains in the bull market. There is a significant psychological advantage to missing the bear market when it comes back to jumping back in.
Contrast this with the perfect investor who captured a 100% gain during the 2003-2007 bull market and another 180% in the second bull market while sitting the bear markets out. That turns into a 560% total return compared to 33% for the buy and hold by late 2015. While it is impossible to be the perfect investor, you would do quite well to exit near the tops and re-enter after a firm bottom has been established.
Two strategies we found that work
Our service provides two strategies to avoid significant losses in the stock market both of which are designed to capture most of the gains of bull markets and avoid most of the losses of bear markets.
The first strategy also avoids many of the significant corrections (losses) in the stock market by simply investing during the time of the year that most of the gains happen and avoiding the time of the year most of the losses happen. The second strategy is to track the indications that lead to bear markets and reduce our exposure to stocks when the risk of a bear market is high.
Our own research was built on significant academic literature and other real-time market timers who found most of the market gains occur during one half of the year (favorable season) and most of the deep market corrections and bear market losses occur during the other half of the year. Like the changing weather, the season's weather does not turn on the same calendar date every year. Our Seasonally-Modified Buy & Hold strategy takes "advantage" of this favorable/unfavorable season effect and is designed to better time the beginning and ending of the favorable season than by simply picking a calendar date. This alone navigated the last two bear markets quite well as you will see on our results page.
The other method for avoiding risk is to understand where we are in the market cycle which is not the same as the business/economic cycle. To keep this concept simple for now, if the market is near the top of the cycle it is time to start lowering our allocation to stocks. The average investor does the opposite which is why it is a market top in the first place. Also remember the stock market is a leading indicator for the economy not the other way around. We try to focus on as many leading stock market indicators as possible in our Current Situation Reports.
What indexes should I invest in?
The indexes that track the small companies have outperformed the larger caps during the last two bull markets, but they also sustain greater losses during the bear markets. They also have greater seasonal tendencies during both bull and bear markets and are excellent choices for seasonal strategies. Exposure to small cap stock indexes should be limited during the unfavorable season each year and during bear markets.
While we believe one should avoid the unfavorable season for all indexes, if one was to stay invested during bull markets I would recommend the larger cap indexes such as the S&P 500 or Dow Jones Industrial Averages. One could then follow the seasonal strategy with small cap indexes which would raise and lower ones exposure to stocks during the year but maintain some exposure all year. One should switch to a full seasonal strategy near market tops and greatly limit exposure to stocks once a bear market is confirmed.
Diversifying with both large and small cap indexes does make sense, but understand they are still highly correlated which means they go up and down together just to varying degrees. I am currently not a fan of international funds since the US has the world's reserve currency which buffers some of the risks other countries cannot avoid. International funds are highly correlated to US stocks during bear markets. The S&P 500 companies do have substantial earnings exposure overseas already, so you are getting some international diversification without the currency risks.
In the short term (days and weeks), bond funds are negatively correlated to stocks but over the long term they are marching to the beat of their own drummer - interest rates. Past returns mean nothing for fixed income and bond funds. The current yield and the direction of interest rates are what matter. With current yields around 2% for 5-year duration fixed income funds such as the TSP F fund, the returns do not match the risk you are assuming as an investor. Let the speculators play with bonds.
What we do
We send out e-mail alerts twice a year to move our members in and out of stock funds based on our historically proven strategy. Since we buy and hold only during the seasonally strong period for stocks we call it the Seasonally-Modified Buy & Hold strategy. We then earn a small return in the other half of the year in a low risk fund.
We also track the leading cyclical indicators for bull markets and bear markets and reduce or eliminate exposure to stocks when the risk of market losses increases. We send e-mail alerts out for this also, plus we provide updates on our website for those who are looking for more information since we do not like to spam our members with constant e-mails. In our e-mails and on our website I provide several timing models to include our Expedient timing model.
I get very specific with our Expedient timing model as to 1) recommended index funds 2) recommended max allocation percentages and 3) timing. Our advantage models provide timing signals twice a year for specfic indexes based on our Seasonally-Modified Buy & Hold strategy. I also adjust exposure recommendations if necessary with the Expedient model in order to further mitigate market risk or capture seasonal strength when less than fully invested.