

Financial disaster is quickly forgotten. There can be few fields of human endeavor in which history counts for so little as in the world of finance.
– John Kenneth Galbraith
Consider two economic systems.
In one, consumers work for employers to produce products and services. The employees are paid wages and salaries, and business owners earn profits. They use much of that income to purchase the goods and services produced by the economy. They save the remainder. A certain portion of the output represents “investment” goods, which are not consumed, and the portion of income not used for consumption – what we call “saving” – is used to directly or indirectly purchase those investment goods.
There may be some goods that are produced and are not purchased, in which case they become unintended “inventory investment,” but in a general sense, this first economic system is a well-functioning illustration of what we call “circular flow” or “general equilibrium.” As is always the case in the end, income equals expenditure, savings equal investment, and output is absorbed either as consumption or investment.
The second economic system is dysfunctional. Consumers work for employers to produce goods and services, but because of past labor market slack, weak bargaining power, and other factors, they are paid meaningfully less than they actually need to meet their consumption plans. The government also runs massive deficits, partly to supplement the income and medical needs of the public, partly to purchase goods and services from corporations, and partly to directly benefit corporations by cutting taxes on profits (despite being the only country in the OECD where corporations pay no value-added tax).
Meanwhile, lopsided corporate profits generate a great deal of saving for individuals at high incomes, who use these savings to finance government and household deficits through loans. This creation of new debt is required so the economy’s output can actually be absorbed. Businesses also use much of their profits to repurchase their own shares, and engage in what amounts, in aggregate, to a massive debt-for-equity swap with public shareholders: through a series of transactions, corporations issue debt to buy back their shares, and investors use the proceeds from selling those shares, directly or indirectly, but by necessity in equilibrium, to purchase the newly issued corporate debt.
The first of these economic systems is self-sustaining: income from productive activity is used to purchase the output of that productive activity in a circular flow. Debt is used primarily as a means to intermediate the savings of individuals to others who use it to finance productive investment.
The second of these economic systems is effectively a Ponzi scheme: the operation of the economy relies on the constant creation of low-grade debt in order to finance consumption and income shortfalls among some members of the economy, using the massive surpluses earned by other members of the economy. Notably, since securities are assets to the holder and liabilities to the issuer, the growing mountain of debt does not represent “wealth” in aggregate. Rather, securities are the evidence of claims and obligations between different individuals in society, created each time funds are intermediated.
So it’s not just debt burdens that expand. Debt ownership also expands, and the debt deteriorates toward progressively lower quality. The dysfunctional economic system provides the illusion of prosperity for some segments of the economy. But in the end, the underlying instability will, as always, be expressed in the form of mass defaults, which effectively re-align the enormous volume of debt with the ability to service those obligations over the long-term.
This is where we find ourselves, once again.
If you examine financial history, you’ll see how this basic narrative has unfolded time and time again, and is repeated largely because of what Galbraith called “the extreme brevity of the financial memory.” Debt-financed prosperity is typically abetted by central banks that encourage consumers and speculators to borrow (the demand side of Ponzi finance) and also encourage yield-seeking demand among investors for newly-issued debt securities that offer a “pickup” in yield (the supply side of Ponzi finance). The heavy issuance of low-grade debt, and the progressive deterioration in credit quality, ultimately combine to produce a debt crisis, and losses follow that wipe out an enormous amount of accumulated saving and securities value. The strains on the income distribution are partially relieved by borrowers defaulting on their obligations, and bondholders receiving less than they expected.
The hallmark of an economic Ponzi scheme is that the operation of the economy relies on the constant creation of low-grade debt in order to finance consumption and income shortfalls among some members of the economy, using the massive surpluses earned by other members of the economy.
Recall how this dynamic played out during the mortgage bubble and the collapse that followed. After the 2000-2002 recession, the Federal Reserve lowered short-term interest rates to 1%, and investors began seeking out securities that would offer them a “pickup” in yield over safe Treasury securities. They found that alternative in mortgage debt, which up to that time had never encountered a crisis, and was considered to be of the highest investment grade. In response to that yield-seeking demand, Wall Street responded by creating more “product” in the form of mortgage securities. To keep yields relatively high, mortgage loans were made to borrowers of lower and lower credit quality, eventually resulting in interest-only, no-doc, and sub-prime loans. The illusory prosperity of rising prices created the impression that the underlying loans were safe, which extended the speculation, and worsened the subsequent crisis.
Why this time feels different
The current speculative episode has recapitulated many of these features, but it’s tempting to imagine that this time is different. It’s not obvious why this belief persists. Certainly, the equity market valuations we observed at the recent highs weren’t wholly unprecedented – on the most reliable measures, the market reached nearly identical valuations at the 1929 and 2000 pre-crash extremes. Likewise, the extreme speculation in low-grade debt securities is not unprecedented. We saw the same behavior at the peak of the housing bubble in 2006-2007. The duration of this advancing half-cycle has been quite extended, of course, but so was the advance from 1990-2000 and from 1921 to 1929.
My sense is that part of what makes present risks so easy to dismiss is that observers familiar with financial history saw the seeds of yet another emerging bubble years ago, yet the bubble unfolded anyway. Nobody learned anything from the global financial crisis. Indeed, the protections enacted after the crisis are presently being dismantled. Extreme “overvalued, overbought, overbullish” market conditions – which closely preceded the 1987, 2000-2002, and 2007-2009 collapses (and contributed to my own success in market cycles prior to 2009) emerged years ago, encouraging my own early and incorrect warnings about impending risk. Our reliance on those syndromes left us crying wolf for quite some time.
In response, many investors have concluded that all apparent risks can be dismissed. This conclusion will likely prove to be fatal, because it implicitly assumes that if one measure proves unreliable (specifically, those “overvalued, overbought, overbullish” syndromes), then nomeasure is reliable. Yet aside from the difficulty with those overextended syndromes, other measures (specifically, the combination of valuations and market internals) would have not only captured the bubble advances of recent decades, but would have also anticipated and navigated the subsequent collapses of 2000-2002 and 2007-2009. I expect the same to be true of the collapse that will likely complete the current cycle.
One should remember that my own reputation on that front was rather spectacular in completemarket cycles prior to the recent speculative half-cycle. So it’s essential to understand exactly what has been different in the period since 2009, and how we’ve adapted.
Emphatically, historically reliable valuation measures have not become any less useful. Valuations provide enormous information about long-term (10-12 year) returns and potential downside risk over the completion of a given market cycle, but they are often completely useless over shorter segments of the cycle. There is nothing new in this.
Likewise, the uniformity or divergence of market action across a wide range of securities, sectors, industries, and security-types provides enormously useful information about the inclination of investors toward speculation or risk-aversion. Indeed, the entire total return of the S&P 500 over the past decade has occurred in periods where our measures of market internals have been favorable. In contrast, the S&P 500 has lost value, on average, in periods when market internals have been unfavorable, with an interim loss during those periods deeper than -50%. Internals are vastly more useful, in my view, than simple trend-following measures such as 200-day moving averages. There is nothing new in this.
The speculative episode of recent years differed from past cycles only in one feature. In prior market cycles across history, there was always a point when enough was enough. Specifically, extreme syndromes of “overvalued, overbought, overbullish” market action were regularly followed, in short order, by air-pockets, panics, or outright collapses. In the face of the Federal Reserve’s zero interest rate experiment, investors continued to speculate well after those extremes repeatedly emerged. This half-cycle was different in that there was no definable limit to the speculation of investors. One had to wait until market internals deteriorated explicitly, indicating a shift in investor psychology from speculation to risk-aversion, before adopting a negative market outlook.
Understand that point, or nearly two thirds of your paper wealth in stocks, by our estimates, will likely be wiped out over the completion of this market cycle.
One of the outcomes of stress-testing our market risk/return classification methods against Depression-era data in 2009 (after a market collapse that we fully anticipated) was that the resulting methods prioritized “overvalued, overbought, overbullish” features of market action ahead of the condition of market internals. In prior market cycles across history, those syndromes typically emerged just before, or hand-in-hand with deterioration in market internals. Quantitative easing and zero-interest rate policy disrupted that overlap. It was detrimental, in recent years, to adopt a negative market outlook in response to extreme “overvalued, overbought, overbullish” features of market action, as one could have successfully done in prior market cycles across history. That was our Achilles Heel in the face of Fed-induced yield-seeking speculation.
Once interest rates hit zero, there was simply no such thing as “too extreme.” Indeed, as long as one imagined that there was any limit at all to speculation, no incremental adaptation was enough. For our part, we finally threw our hands up late last year and imposed the requirement that market internals must deteriorate explicitly in order to adopt a negative outlook. No exceptions.
The lesson to be learned from quantitative easing, zero-interest rate policy, and the bubble advance of recent years is simple: one must accept that there is no limit at all to the myopic speculation and self-interested amnesia of Wall Street. Bubbles and crashes will repeat again and again, and nothing will be learned from them. However, that does not mean abandoning the information from valuations or market internals. It means refraining from a negative market outlook, even amid extreme valuations and reckless speculation, until dispersion and divergences emerge in market internals (signaling a shift in investor psychology from speculation to risk-aversion). A neutral outlook is fine if conditions are sufficiently overextended, but defer a negative market outlook until market internals deteriorate.
Learn that lesson with us, and you’ll be better prepared not only to navigate future bubbles, but also to avoid being lulled into complacency when the combination of extreme valuations and deteriorating market internals opens up a trap door to subsequent collapse.
This half-cycle was different in that there was no definable limit to the speculation of investors. One had to wait until market internals deteriorated explicitly, indicating a shift in investor psychology from speculation to risk-aversion, before adopting a negative market outlook.
Prioritizing market internals ahead of “overvalued, overbought, overbullish” syndromes addresses the difficulty we encountered in this cycle, yet also preserves the considerations that effectively allowed us to anticipate the 2000-2002 and 2007-2009 collapses.
When extreme valuations are joined by deteriorating market internals (what we used to call “trend uniformity”), downside pressures can increase enormously. Recall my discussion of these considerations in October 2000:
“The information contained in earnings, balance sheets and economic releases is only a fraction of what is known by others. The action of prices and trading volume reveals other important information that traders are willing to back with real money. This is why trend uniformity is so crucial to our Market Climate approach. Historically, when trend uniformity has been positive, stocks have generally ignored overvaluation, no matter how extreme. When the market loses that uniformity, valuations often matter suddenly and with a vengeance. This is a lesson best learned before a crash than after one. Valuations, trend uniformity, and yield pressures are now uniformly unfavorable, and the market faces extreme risk in this environment.”
I emphasized the same considerations in August 2007, just before the global financial crisis:
“Remember, valuation often has little impact on short-term returns (though the impact can be quite violent once internal market action deteriorates, indicating that investors are becoming averse to risk). Still, valuations have an enormous impact on long-term returns, particularly at the horizon of 7 years and beyond. The recent market advance should do nothing to undermine the confidence that investors have in historically reliable, theoretically sound, carefully constructed measures of market valuation. Indeed, there is no evidence that historically reliable valuation measures have lost their validity. Though the stock market has maintained relatively high multiples since the late-1990’s, those multiples have thus far been associated with poor extended returns. Specifically, based on the most recent, reasonably long-term period available, the S&P 500 has (predictably) lagged Treasury bills for not just seven years, but now more than eight-and-a-half years. Investors will place themselves in quite a bit of danger if they believe that the ‘echo bubble’ from the 2002 lows is some sort of new era for valuations.”
It’s very easy to forget that by the 2009 low, investors in the S&P 500 had lost nearly 50%, including dividends, over the preceding 9 years, and had underperformed Treasury bills for nearly 14 years. Yet on the valuation measures we find best correlated with actual subsequent S&P 500 total returns, recent valuation extremes rival or exceed those of 1929 and 2000.
The lesson to be learned from quantitative easing, zero-interest rate policy, and the bubble advance of recent years is simple: one must accept that there is no limit at all to the myopic speculation and self-interested amnesia of Wall Street. Bubbles and crashes will repeat again and again, and nothing will be learned from them.
However, that does not mean abandoning the information from valuations or market internals. It means refraining from a negative market outlook, even amid extreme valuations and reckless speculation, until dispersion and divergences emerge in market internals. A neutral outlook is fine if conditions are sufficiently overextended, but defer a negative market outlook until market internals deteriorate.
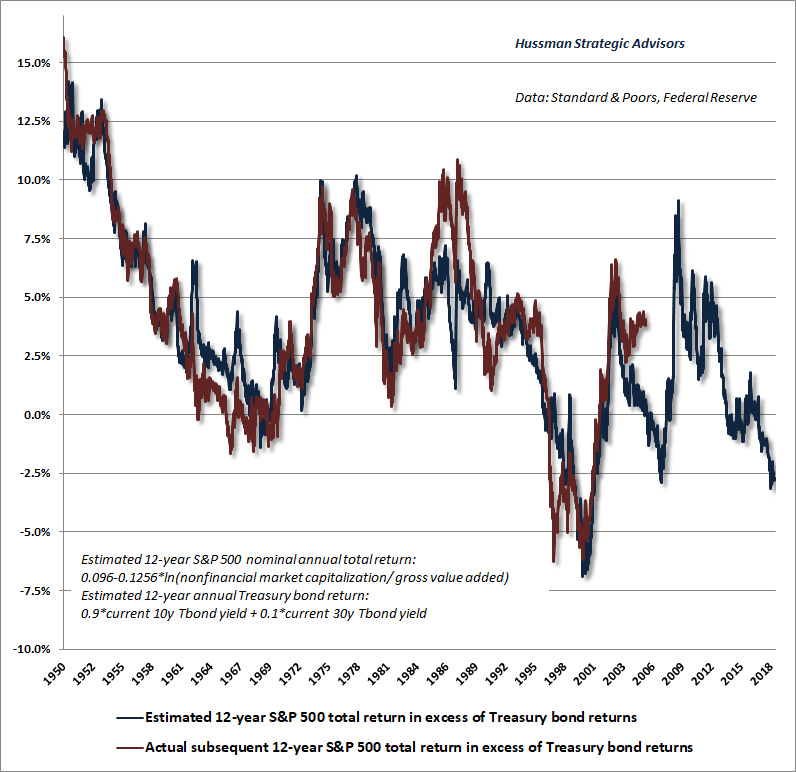
At present, our measures of market internals remain unfavorable, as they have been since the week of February 2, and our most reliable measures of valuation remain at offensive extremes. If market internals improve, we’ll immediately adopt a neutral outlook (or possibly even constructive with a strong safety net). Here and now, however, we remain alert that there is an open trap door, in a market that I fully to expect to reach 1100 or lower on the S&P 500 over the completion of this cycle, and to post negative total returns over the coming 12-year horizon.
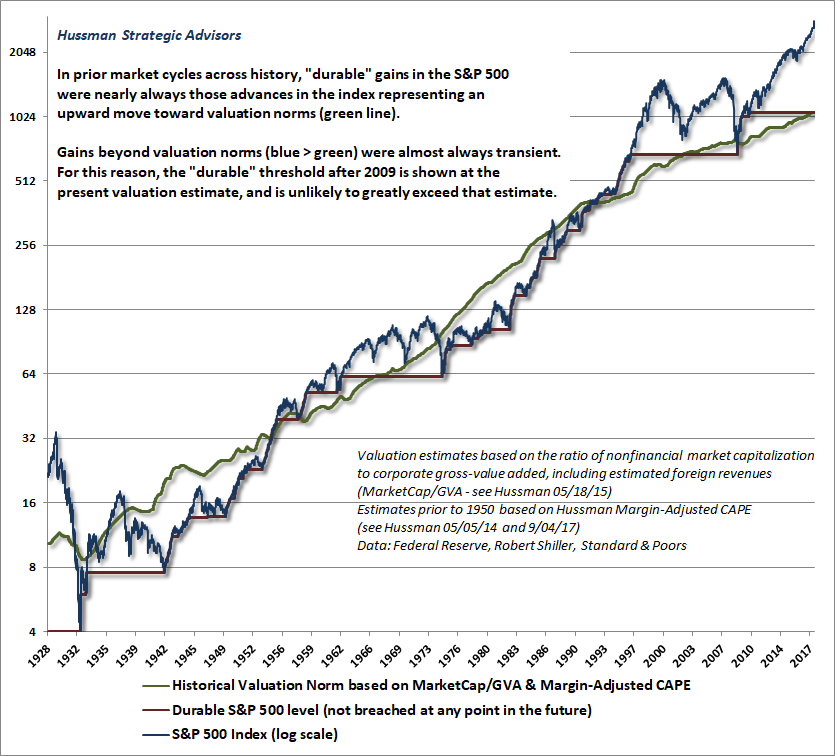
Remember how market cycles work. There is a durable component to gains, and a transitory component. The durable component is generally represented by gains that take the market up toward reliable historical valuation norms (the green line on the chart below). The transitory component is generally represented by gains that take the market beyond those norms. Based on the measures we find most reliable across history, we presently estimate the threshold between durable and transient to be roughly the 1100 level on the S&P 500, a threshold that we expect to advance by only about 4% annually in the years ahead. Most bear market declines breach those valuation norms, and the ones that don’t (1966, 2002) see those norms breached in a subsequent cycle. We have no expectation that the completion of the current market cycle will be different.
The Ponzi Economy
Let’s return to the concept of a dysfunctional economy, where consumption is largely financed by accumulating debt liabilities to supplement inadequate wages and salaries, where government runs massive fiscal deficits, not only to support the income shortfalls of its citizens, but increasingly to serve and enhance corporate profits themselves, and where corporations enjoy lopsided profits with which they further leverage the economy by engaging in a massive swap of equity with debt.
This setup would be an interesting theoretical study in risk and disequilibrium were it not for the fact that this is actually the situation that presently exists in the U.S. economy.
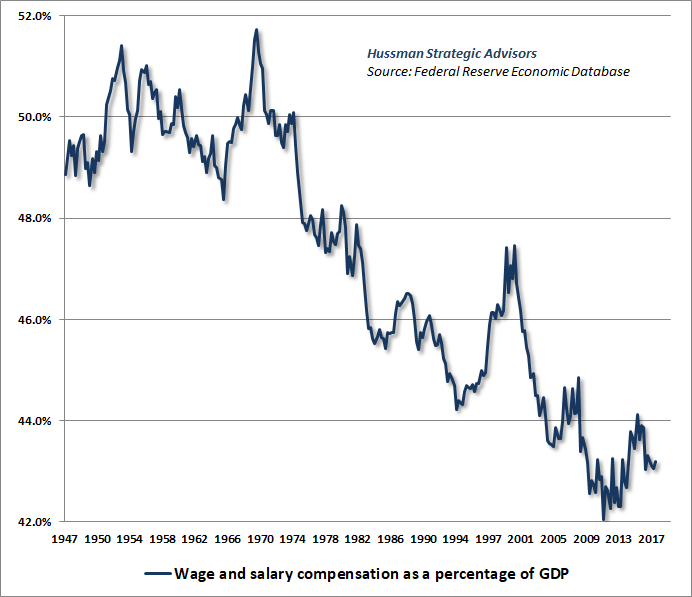
The chart below shows wages and salaries as a share of GDP. This share reached a record low in late-2011, at the same point that U.S. corporate profits peaked as a share of GDP. That extreme was initially followed by a rebound, but the share has slipped again in the past couple of years.
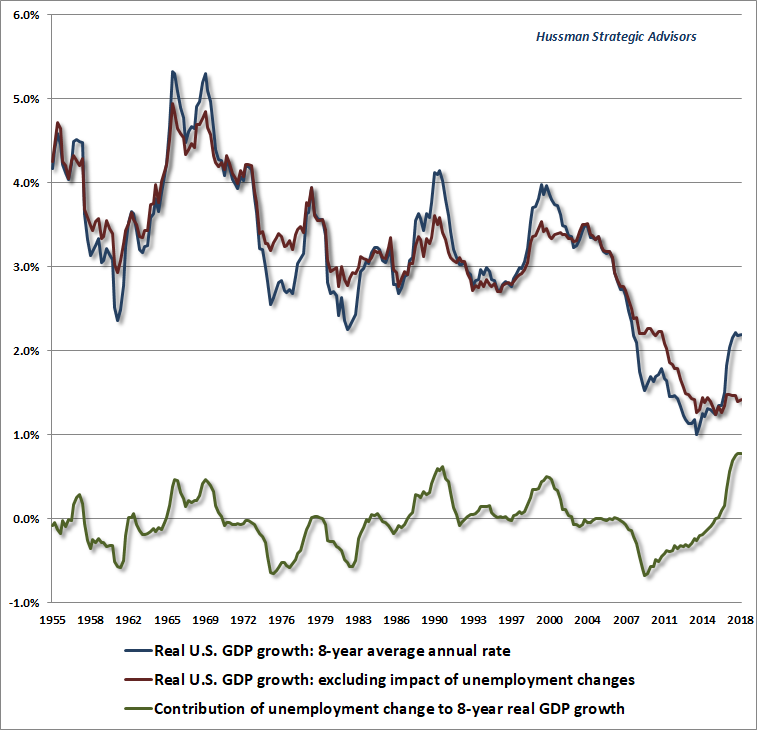
With the unemployment rate falling to just 3.8% in the May report, inflation in weekly average earnings has pushed up to 3%, and is likely to outpace general price inflation in the coming quarters. Meanwhile, amid the optimism of a 3.8% unemployment rate (matching the rate observed at the 2000 market peak), investors appear to ignore the implication that this has for economic growth. The fact is that nearly half of the economic growth we’ve observed in the U.S. economy in this recovery has been driven by a reduction in the unemployment rate. The red line below shows how the underlying “structural” growth rate of the U.S. economy has slowed in recent decades.
Based on population and demographic factors, even if the unemployment rate remains at 3.8% in 2024, employment growth will contribute just 0.6% annually to GDP growth, leaving productivity growth (averaging well below 1% annually in the recovery since 2010) to contribute the balance. Without the cyclical contribution of a falling unemployment rate, real U.S. economic growth is likely to slow to well-below 2% annually, and even that assumes the economy will avoid a recession in the years ahead.
Wage inflation has been quite limited in the aftermath of job losses during the global financial crisis. Given a tightening labor market, an acceleration of wage gains will be good news for employees, but the delay has contributed to quite a few distortions in the interim.
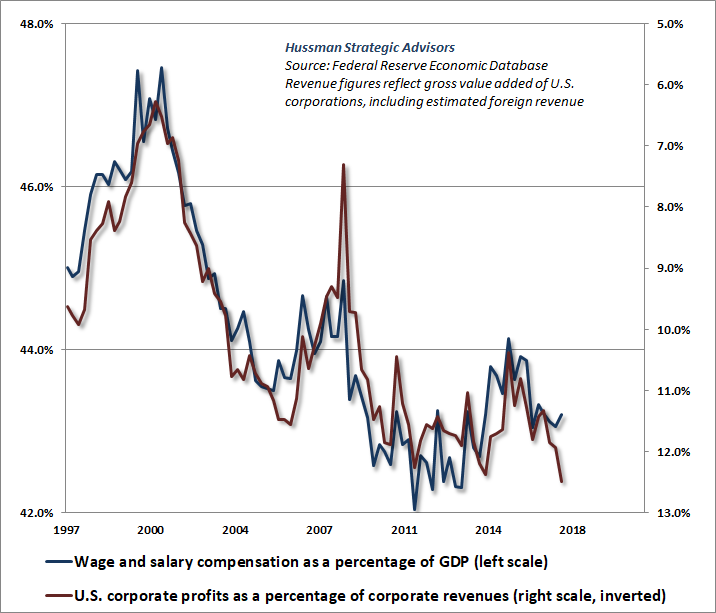
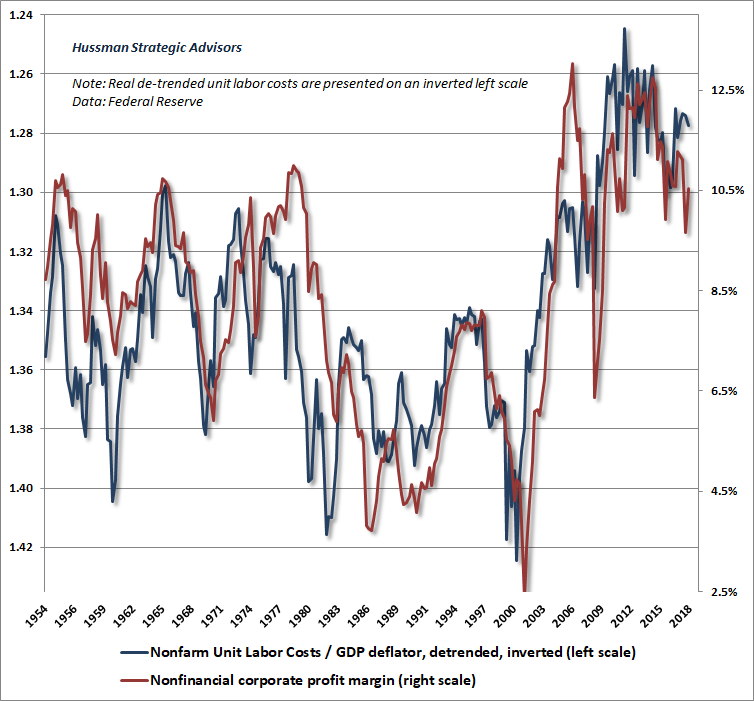
One clear distortion is that profit margins have been higher and more resilient in this cycle than in prior economic cycles. Again, this elevation of profit margins is a mirror image of slack labor markets and weak growth in wages and salaries. The relationship isn’t perfect, as a result of quarter-to-quarter volatility, but the inverse relationship between the two is clear.
A good way to understand the relationship between wages and profits is to think in terms of unit labor costs. Consider a generic unit of output. The revenue of generic output is measured by the economy-wide GDP price deflator. The cost of employment embedded into that output is measured by unit labor cost (ULC). Accordingly, we would expect profit margins to increase when unit labor costs rise slower than the GDP deflator, and we would expect profit margins to fall when unit labor costs rise faster than the GDP deflator. That’s exactly what we observe in the data.
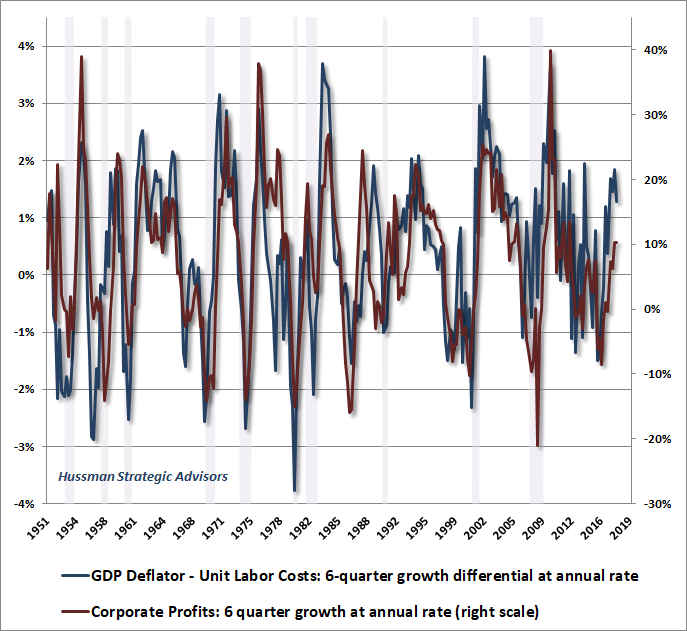
The same relationship can be observed in the way that profits increase and decrease over the economic cycle.
Now remember how we talked about the “circular flow” of the economy? One consequence of equilibrium, which has to hold even in a dysfunctional economy, is that income is equal to expenditure (remember, we’re including investment, and even unintended inventory accumulation), and savings are equal to investment.
When U.S. corporate profits are unusually high, it’s typically an indication that households and the government are cutting their savings and going into debt.
In an open economy like ours, we can measure not only savings by households and the government, but also the amount of savings that foreigners send to the economy by purchasing securities from us. As it happens, that “inflow” of foreign savings is the mirror image of our current account deficit, because if we don’t pay for our imports by sending foreigners goods and services, it turns out that we pay for them by sending them securities. Because the “balance of payments” always sums to zero, whenever we export securities to foreigners, on balance, we also run a trade deficit. Since real investment in factories, capital goods, and housing has to be financed by savings, you’ll also find that our trade deficit regularly “deteriorates” during U.S. investment booms, and “improves” during recessions.
So here’s an interesting way to think about corporate profits: since gross domestic investment has to be financed by total savings (household, government, foreign, corporate), and because fluctuations in gross domestic investment are largely financed by fluctuations in foreign capital inflows, we would expect corporate profits to be high when the sum of household and government savings is low. Indeed, that’s exactly what we find. [Geek’s note: basically, if dI = dH + dG + dF + dC, and dI ~ dF, then dC ~ -(dH+dG)]
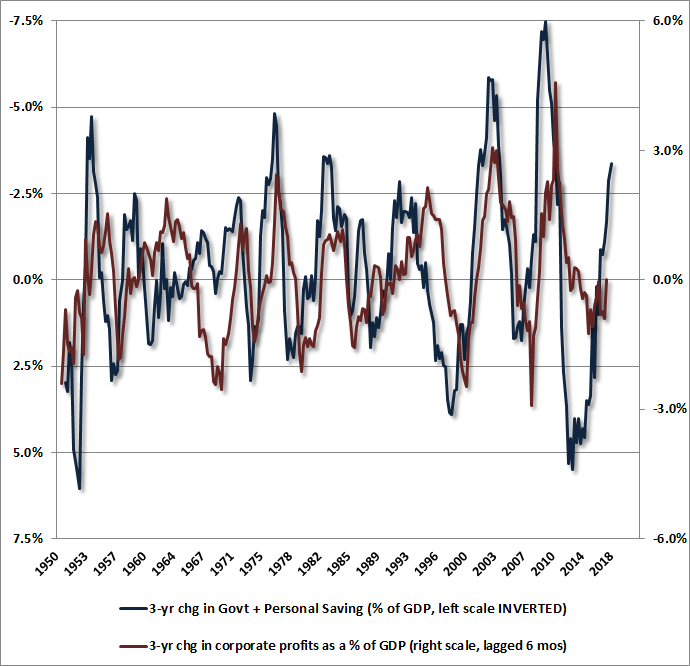
Put simply, when U.S. corporate profits are unusually high, it’s typically an indication that households and the government are cutting their savings and going into debt. Combine this with the fact that corporate profits move inversely to wage and salary income, and it should be evident that the surface prosperity of the U.S. economy masks a Ponzi dynamic underneath. Specifically, corporations are highly profitable precisely because wage and salary growth was deeply depressed by the labor market slack that followed the global financial crisis. In the interim, households have bridged the gap by going increasingly into debt, while government deficits have also increased, both to provide income (and health care) support, and to benefit corporations directly.
Record corporate profits are essentially the upside-down, mirror image of a dysfunctional economy going into extreme indebtedness.
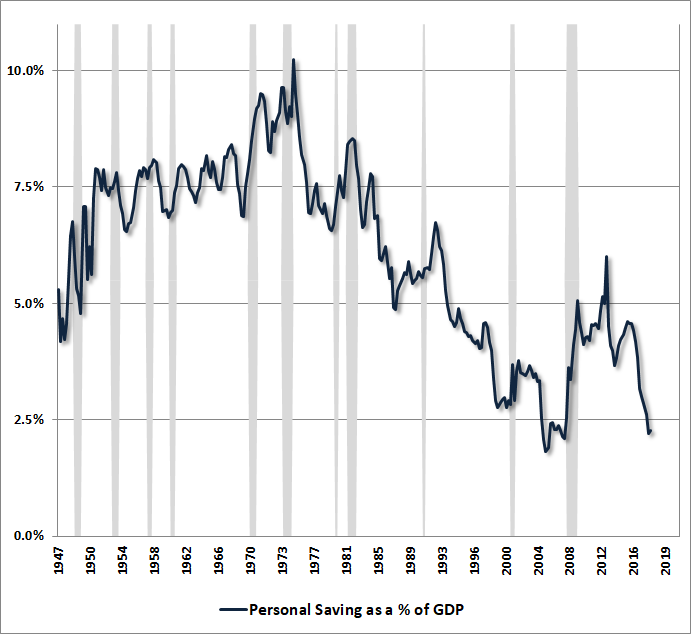
The chart below shows personal saving as a share of GDP. At present, saving is at the lowest level since the “equity extraction” bonanza that accompanied the housing bubble. Only in this instance, the low rate of saving largely reflects depressed incomes rather than extravagant consumption.
In a Ponzi economy, the gap between income and consumption has to be bridged by increasing levels of debt. The chart below illustrates this dynamic. Total federal public debt now stands at 106% of GDP, and about 77% of GDP if one excludes the Social Security trust fund and other intragovernmental debt. Both figures are the highest in history. Not surprisingly, consumer credit as a share of wage and salary income has also pushed to the highest level in history.
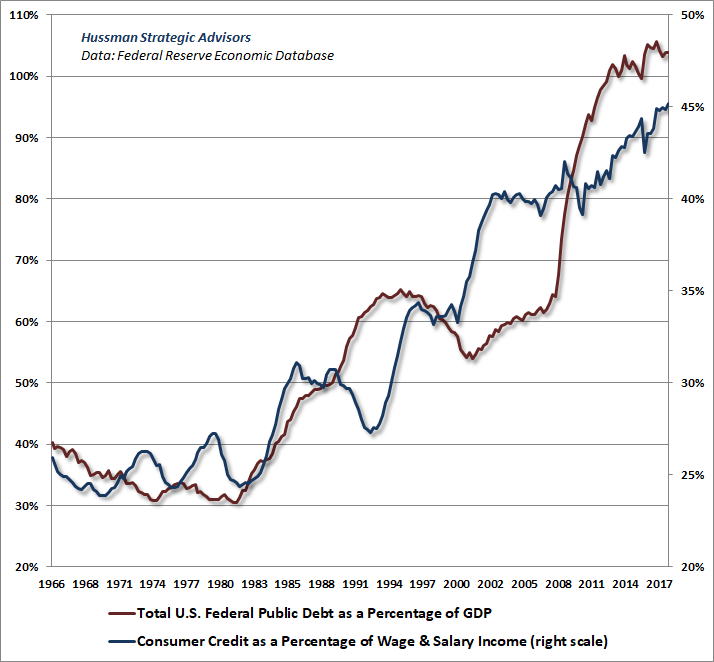
To put the U.S. federal debt into perspective, only 12 countries have higher ratios of gross government debt to GDP, the largest being Japan, Greece, Italy, and Singapore. The only reason we aren’t as vulnerable to credit strains as say, Italy or Greece, is that those peripheral European countries do not have their own independent central banks and therefore have no “printing press” to backstop their promises. Rather, the European Central Bank can only buy the debt of individual member countries in proportion to their size, unless those countries submit to full austerity plans. That’s why we continue to monitor European banks, many which carry the same level of gross leverage today as U.S. banks prior to the global financial crisis. The most leveraged among them is Deutsche Bank (DB), which plunged to a record low last week, and is particularly worth watching.
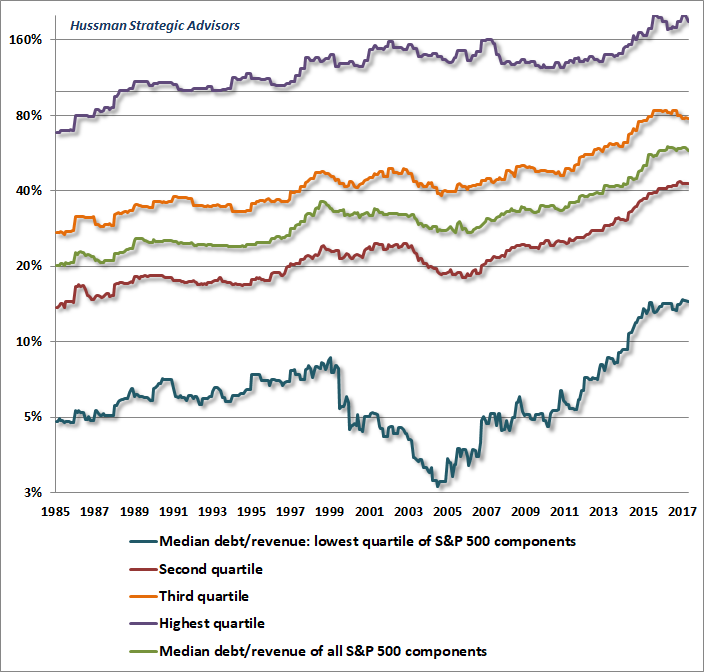
Despite record profits, high debt issuance has also infected corporate balance sheets, as companies lever themselves up by repurchasing their own shares. The chart below shows median ratio of debt to revenue among S&P 500 components, as well as the median ratios sorted by quartile. The chart is presented on log scale, with each division showing a doubling in debt/revenue (thanks to our resident math guru Russell Jackson for compiling this data). In recent years, corporate debt has advanced to the highest fraction of revenues in history, nearly tripling from 1985 levels across every quartile.
Moody’s observed last week that since 2009, the number of global nonfinancial companies rated as speculative or junk has surged by 58%, to the highest proportion in history. Despite the low rate of defaults at present, Moody’s warns that future periods of economic stress will cause a “particularly large” wave of defaults (h/t Lisa Abramowicz, Jeff Cox).
Without the cyclical contribution of a falling unemployment rate, real U.S. economic growth is likely to slow to well-below 2% annually, and even that assumes the economy will avoid a recession in the years ahead.
The expansion of junk and near-junk credit has again extended to commercial mortgage bonds, where interest-only loans now account for over 75% of the underlying debt. Bloomberg notes that “as investors have flocked to debt investments that seem safe, underwriters have been emboldened to make the instruments riskier and keep yields relatively high by removing or watering down protections.”
Similar deterioration is evident in the $1 trillion market for leveraged loans (loans to already heavily indebted borrowers), where “covenant lite” loans, which offer fewer protections to lenders in the event of default, now account for 77% of loans. Leveraged loans are catching up to the U.S. high-yield market, which accounts for another $1.2 trillion in debt.
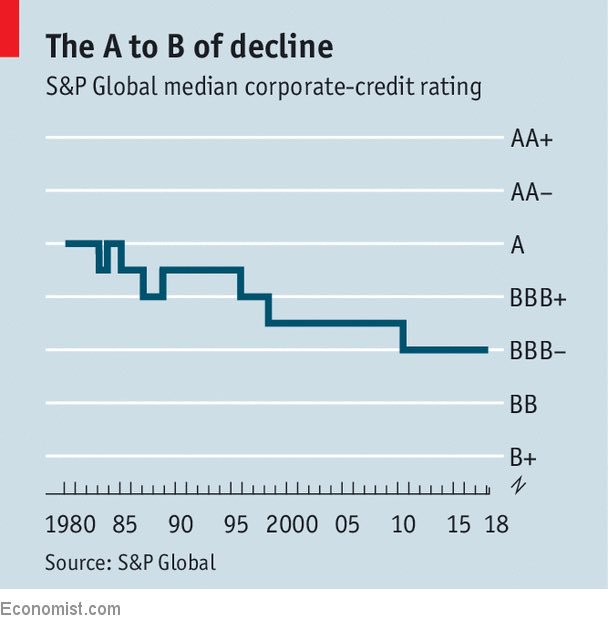
Meanwhile, the median corporate credit rating has dropped to BBB- according to S&P Global. That’s just one notch above high yield, speculative-grade junk. Oaktree Capital (where Howard Marks is Co-Chair), told Bloomberg last week that it expects “a flood of troubled credits topping $1 trillion. The supply of low quality debt is significantly higher than prior periods, while the lack of covenant protections makes investing in shaky creditors riskier than ever. Those flows could mean debt will fall into distress quickly.”
h/t Jesse Felder
The bottom line is that the combination of wildly experimental monetary policy and subdued growth in wages and salaries in the recovery from the global financial crisis has contributed to a dysfunctional equilibrium, with massive increases in debt burdens at the government, household, and corporate level. The quality of this debt has progressively weakened, both because of lighter covenants and underwriting standards, and because of a more general deterioration in credit ratings and servicing capacity.
Low household savings and growing consumer debt, born of depressed wage and salary compensation, have contributed to temporarily elevated profit margins that investors have treated as permanent. Corporations, enticed by low interest rates, have engaged in a massive leveraged buy-out of stocks, partly to offset dilution from stock grants to executives, and apparently in the misguided belief that valuations and subsequent market returns are unrelated. Equity valuations, on the most reliable measures, rival or exceed those observed at the 1929 and 2000 market extremes. By our estimates, stocks are likely to substantially underperform Treasury bond yields in the coming 10-12 years. Emphatically, valuation extremes cannot be “justified” by low interest rates, because when interest rates are low because growth rates are also low, no valuation premium is “justified” at all.
Amid these risks, I’ll emphasize again that our immediate, near-term outlook would become much more neutral (or even constructive with a strong safety net) if an improvement in market internals was to indicate fresh speculative psychology among investors. Still, further speculation would only make the completion of this cycle even worse.
The hallmark of an economic Ponzi scheme is that the operation of the economy relies on the constant creation of low-grade debt in order to finance consumption and income shortfalls among some members of the economy, using the massive surpluses earned by other members of the economy. The debt burdens, speculation, and skewed valuations most responsible for today’s lopsided prosperity are exactly the seeds from which the next crisis will spring.