


-
-
-
About Our Almanacs
-
-
-
-
-
-
-
A Traders Almanac
Stock Traders Almanac based on *trading days*
Our Almanacs have evolved and will continue to evolve as we find ways to refine the effects of the seasonal flows into and out of the markets. Not everything we learn can or should be included in our almanacs so we will talk about these from time-to-time. Some flows are temporary or transitory based on monetary or fiscal and trade policy changes. The point of our almanacs is to capture the seasonal tendencies that are always there even if they are overwhelmed by short-term factors. They are an additional investing tool and can explain many movements that the media simply tack some current event explanation to.
Unlike other almanacs, ours are based on trading days of the month and not calendar days. We anchor our data on the 1st and last trading days of each month and the 15th of each month. If the 15th is on the weekend, we typically use the last trading day proceeding the 15th. For example the first trading day of the month may be on the 1st or 2nd or 3rd calendar day of the month. The first trading day may be a Monday through a Friday. Using straight calendar days skews seasonal patterns.
We made a few changes starting in our 2016 Almanacs that provided better seasonal analysis. The primary change was we present data after with and without the bear market years since 1988. By doing this we eliminate both the volatility of steep bear declines as well as the significant rallies off the market bottoms from both the daily seasonals and monthly seasonals. This gives us a clearer picture of the seasonal tendencies of the market under normal circumstances. Bear markets simply skew the data with the massive swings.
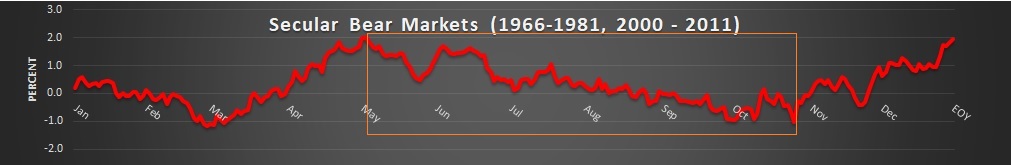
We plot our almanac data together on a single graph to paint the picture. We provide a combined table for side-by-side viewing of large cap and small cap daily seasonal tendencies. We have additional charts such as secular bull and bear market price progressions. The chart below is just an example but not one of our better charts for investing. The bull market charts are most useful to understand.
Our shorter term seasonal look starts in 1988 for two reasons. First the Dow Jones Total US Market Completion Index began publishing daily prices in late January 1987. By starting our data after 1987 we avoid including the market crash in late 1987 which would also skew the daily seasonal tendencies of the market. This "Completion" index includes all the US listed stocks not in the SP500, completing the Total US market. This index includes the broader market made up of 3400 companies today compared to the 500 or so companies in the SP500 index. But it only accounts for about 20% of the market capitalization of the Total US market. We call it the non-sp500 index.
The TSP S fund tracks this completion index. The low cost Vanguard VXF ETF also tracks this same index. What you will notice about this index is that it has greater seasonal tendencies than the larger SP500 index. It makes an excellent candidate for seasonal investing.
The bear market years we eliminated in our almanac were 2001 – 2003 and 2008 – 2009. Both 2003 & 2009 were market bottom years that had sharp declines and then bounced back over the summers skewing the seasonals in both directions. Since the bull market top years in 2000 and 2007 were both mild we left them in the bull market data. We also know bull market tops are not readily identifiable as they were occurring nor will future tops.
Other goodies
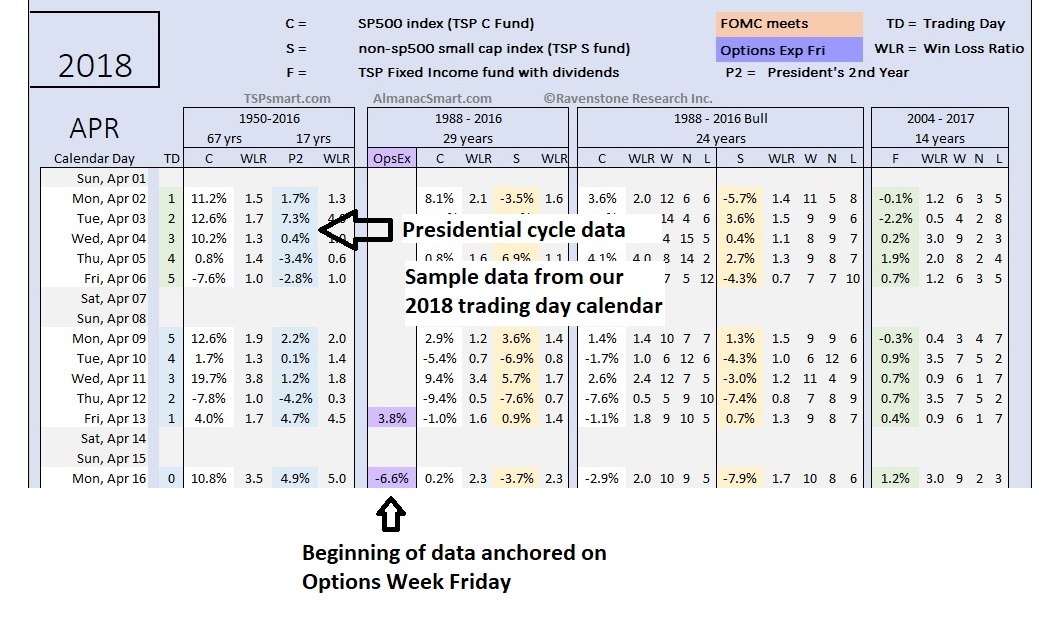
We note the FOMC meeting dates each year (w/announcements) since the two day tendency is a positive 0.5% to 0.75% on average. The FOMC meeting is not the same week or calendar days each year, so their effect is not specific to the same trading day each year. Please review the FOMC Statement Price Pattern.
We also highlight the options week Friday which is the third Friday of each month. We have noticed a pattern recently that is a part of the mid-month bump in the indexes. Not all months are the same. We pulled the Triple Witching months data and produced the Triple Witching Effect on Index Funds which is worth reviewing. The options data appears to be more telling of daily seasonal tendencies during the middle of the month than using the mid-point such as the 15th. Our almanacs still remain anchored on the 15th or the nearest trading day to the 15th since options expiration swings over 5 trading days each year depending on which day the 1st day of the month falls on.
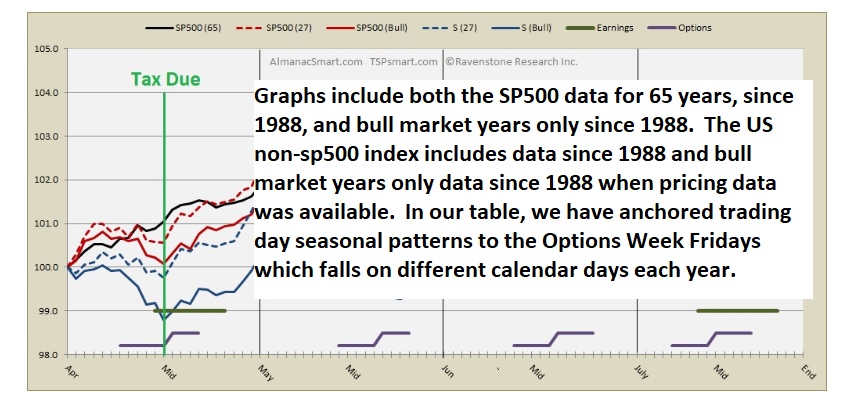
We divide our almanacs up into four webpages, one for each quarter. This should make your page loading and navigation quicker. At the top of the page for the combined almanac will be a graph like the one below. "S" stands for the TSP S fund which tracks the Dow Jones Total US Completion Index which I like to simply call the "non-sp500 index". We use the *price only* Dow Jones Total US Stock Market Completion index for our data. The "(27)" means all 27 years from 1988 to 2014. "Bull" means the 22 bull market years during this time frame. The horizontal green line denotes the first two weeks of earnings announcements. The purple lines show the range of options week for the data plotted.
Our almanac daily data is cumulative data for that trading day. It allows you to compare columns and do the math. For example, if the month of January since 1950 for the SP500 has a cumulative total of 100% gain, but the Presidential year has a total of only 10% then you know the other 3 years of the cycle have 90% of the gains and the current year of a new President is typically weak.
I recommend looking at at least 3 trading day returns when considering seasonal data. If one day shows -12% and the next day shows +10%, then I see this data as canceling each other out unless the specific reason for the difference is understood. Was it due to a single year where the market crashed one day and bounced back the next day and skewed the seasonal data or does a +10% fall on Options Expiration Friday, then on Monday the market falls 12% cumulatively.
Our Almanacs are provided to full access members who chose "almanac access". See our Levels of Service options if you are not a member.
If you want access to the Almanacs, you can sign up at the Almanac membership level.
More info on our almanacs
The charts are most helpful for the overall effects of the daily progressions.
You will find the following columns:
65 years of SP500 data
29 years of data (SP500 & small caps) that started in 1988 after 1) small cap indexes became available and 2) after the effects of the 1987 market crash
24 years of data (SP500 and small caps) from the same 29 years above minus the large gyrations of the bear market years... I consider this the cleanest seasonal data.
The TSP F fund is the US aggregate bond index (AGG ETF)... we have less years of data, but it shows how it mostly moves opposite of the equity funds. The TSP F fund has an interesting seasonal effect the AGG ETF does not based on when dividends are re-invested each month.
Each month is anchored on the 1st trading day of the month (not a calendar day).
Each month is also anchored on the mid-day, but the Options Expirations date (Third Friday of each month) provides a different mid-month look at the seasonal progression of the months.
All the data is cumulative for that day over 65 years or 29 years which makes it easier to see and allows comparing years.
I believe these seasonal "tendencies" are always there in the background but other factors move the markets too. The seasonal investor tool allows you to increase your trade odds. Don't go against strong seasonal negatives and don't miss strong seasonal tail winds.
With that said, I see larger central bank flows into the markets this cycle that are increasing in amplitude and is really distorting the markets. Since March 2020 the distortion has been in a massive valuation expansion backed by little fundamental improvement.