

-
-
-
-
-
-
The Smart Bird
-
Be the Smart Bird
Political Finance & History
My bias and my mission to understand the next chart
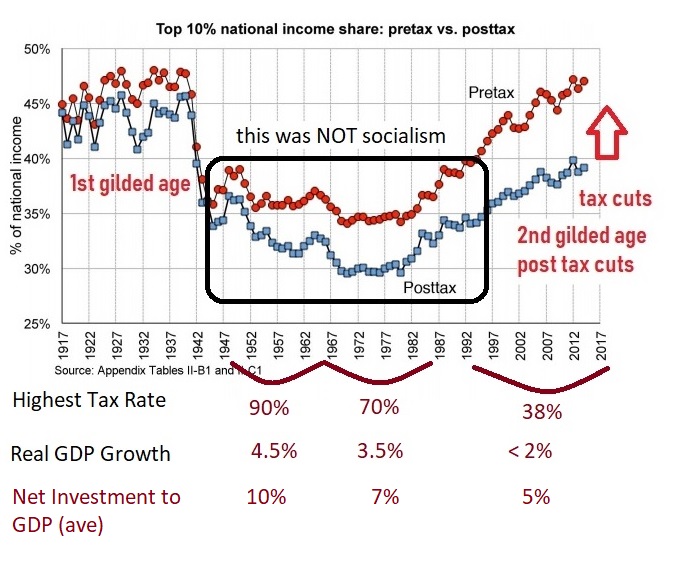
The gilded age was not a good time to live and work in America. It was a period of concentrated wealth and power. What is interesting in the chart is that high tax rate periods post-gilded age also had high real GDP growth and net investment.
What I've learned so far is:
1) High tax rates force investment for tax deductions for those with wealth to keep their wealth (lower effective tax rate). Low tax rates like today will allow hoarding, non-investment and lead to a slower recovery.
2) The rich have a low marginal propensity to consumer meaning they do not spend on the economy, they invest. And today, they are plowing their money into the financial markets leading to record valuations with low economic growth.
3) With flat wages and deleveraging, the consumer who has a HIGH marginal propensity to consumer is the reason we had the slowest economic recovery ever after the last recession. Our system is unbalanced and the economy suffered.
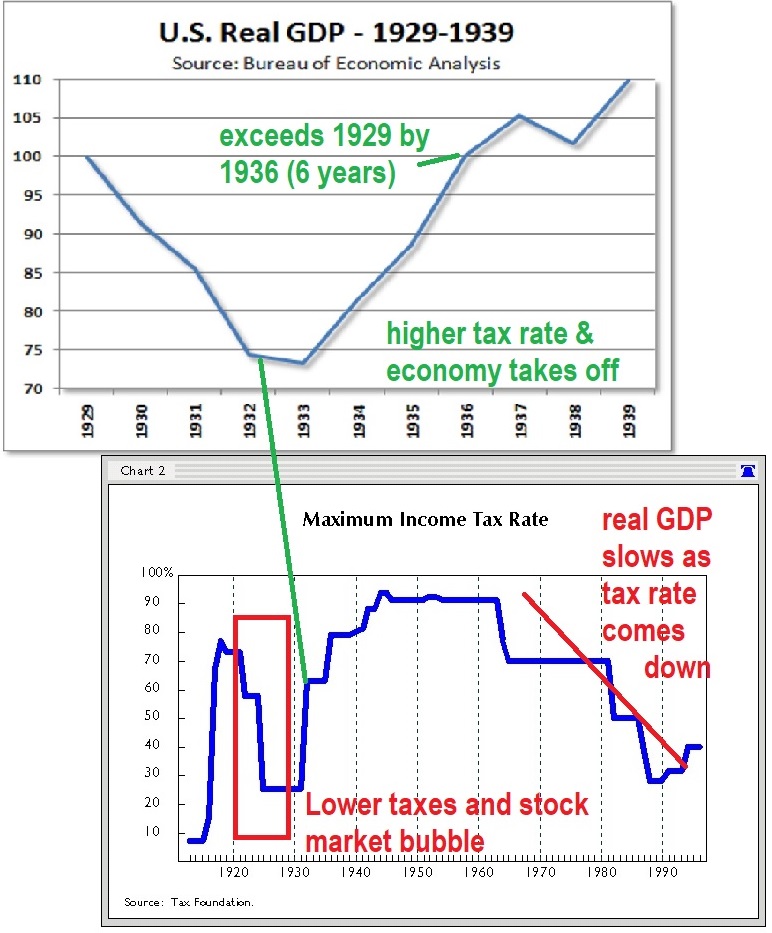
We have also seen bubbles develop after large tax cuts. This next chart takes us back to the 1929 bubble and depression. The lower chart shows a massive upper tax rate cut in 1920 that proceeded the stock market bubble.
Interestingly, the economy started climbing sharply AFTER they raised taxes back over 80% for the top tax rate. Remember, this is not what the rich paid because if they invest they can deduct investments and expenses from taxes.
I am not so much trying to prove that higher upper tax rates lead to higher economic growth as I am to dismiss claims that lower taxes lead to higher real GDP growth. It does not. It does lead to greater inequality that then causes the problems we are having today.
If you want a more academic explanation you can review Income Inequality, Financial Crises, and Monetary Policy published by the Federal Reserve.
Here is one excerpt:
Third, and perhaps most importantly, income inequality plays a crucial role for the overall stability of the financial system. When a growing share of national income is allocated to a group with the lowest marginal propensity to consumer (MPC), unused income has to be stored in financial claims. Those claims may represent investment in real assets such as physical capital or borrowing of lower-income groups. In this latter case, a link between income inequality and excessive credit expansion that endangers the soundness of financial system might arise.