


-
-
-
-
-
-
Applying Filters
-
-
-
-
-
"to every thing there is a season..."
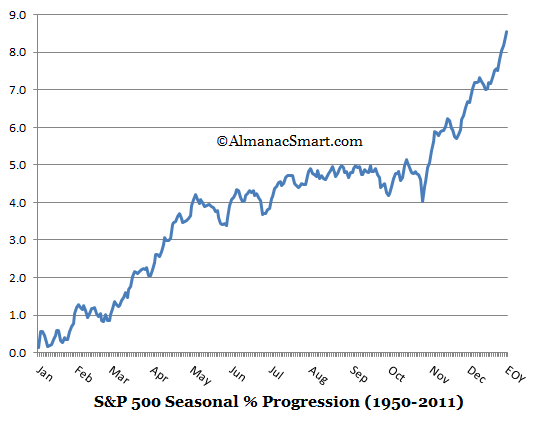
Seasonal tendencies (also known as the calendar effects) are the patterns of prices based on the day(s) of the year in individual companies & commodities, sectors or the broad markets indexes. One example is the mid-summer peak of corn prices as corn supplies diminish, and then the fall in prices as the new harvest comes to market. The driver of seasonal tendencies in the stock market is attributed to money flows based on calendar based liquidity patterns (e.g. automatic 401K deposits from paychecks, end-of-year bonuses, companies matching 401K contributions at the end of the year all at once), sentiment (e.g. holiday-effect, political-fiscal policy), and financial reporting (i.e. end-of-year window dressing) to name a few. The time frame for seasonal studies includes time-of-day fluctuations to multi-year cycles.
Hundreds of academic studies have confirmed the existence of stock market seasonal patterns in most of the global stock markets--some of these studies look back over a hundred years. We live in a world of seasons to include man's need to invest and his need for money. One academic meta-analysis on the market's seasonal patterns resulted in an academia book that placed these studies within the context of Keynes’ theory of investor liquidity preferences found in John Maynard Keynes 1936 work entitled The General Theory of Employment Interest and Money. Until recently the transaction costs and tax consequences of trading diminished the effectiveness of seasonal investing for retail investors. The absence of these issues and better analysis now makes it unwise to ignore applying a seasonal filter to one's investments.
The key benefit of including a seasonal indicator in investment allocation decisions is that it does not correlate to other technical or fundamental signal generators. Used simply as a stand-alone timing filter, it has historically been shown to decrease exposure to the unfavorable season’s drawdowns while maintaining exposure to the favorable season’s price appreciation. Combining a seasonal filter with other technical indicators or fundamental analysis can further increased long-term investment returns with reduced risk. Beating the index every year is not the purpose of applying a seasonal filter to investing. The primary purpose is to lower risk and increase full market cycle returns.
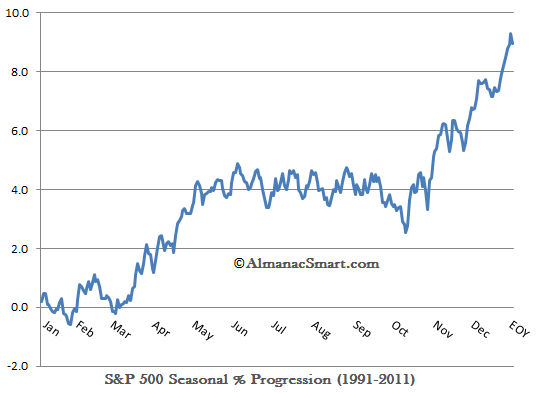
From the 20 year chart above we note the average price progression of the S&P 500 was approximately 9% a year during this time span. Most of the appreciation took place during March - June and from the October lows through the end of December. The summer lull during this timeframe averaged from early June until late October. An investor might be tempted to buy and sell based off the best dates in the chart above and they would do pretty good if the stuck to it for 20 years, but they would be surprised at the variations over the years that produce an average seasonal result. Applying additional indicators would increase long term results due to the variations of the summer lull and cycle of the market. The charts below capture the a snapshot of the effect of the 4-year Political-Fiscal or Presidential cycle over the same time frame. Note the variations, but the consistent existence of a summer lull.
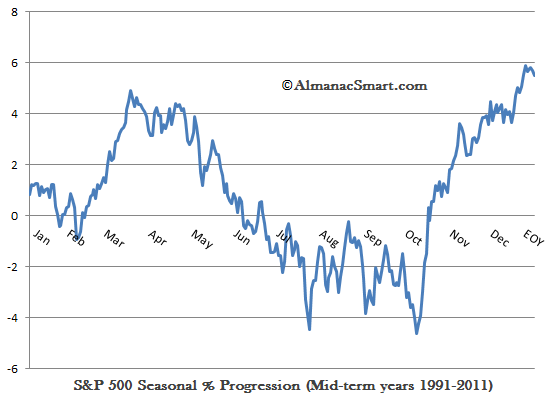
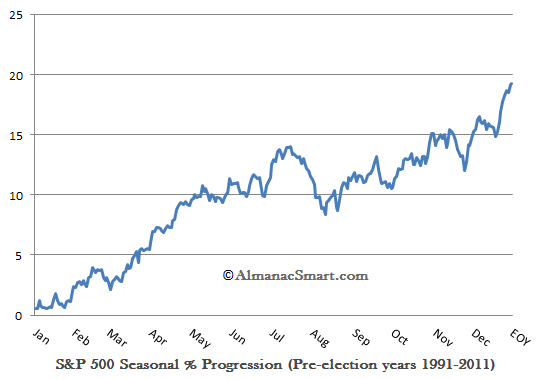
The above snapshot shows the weakness of the Mid-Term Presidential weak season on the S&P 500 during this time span and the below-average annual return. In contrast, the chart below shows the Pre-Election calendar year's average annual price appreciation of close to 20% during this time span. The summer lull still exists, but has a slight appreciation in the price from May until October with an August correction. Again, the charts are averages and are provided for informational purposes only, not for investment decisions.
The seasonal tendencies described here effect the total US stock market as observed in the DJIA, the S&P 500, the Russell 2000, or the Wilshire 5000 to name a few. The primary seasonal filters an investor should consider are the annual strong/weak season and the political-fiscal cycle for adjusting exposure to equities. The turn-of-the-year effect (Dec-Jan) has been a good time to increase equity exposure historically. While we only focus on a few, the following list breaks the most commonly studied effects down into calendar events (days), seasons (months) and cycles (greater than a year).
Event Based (i.e. Calendar Day and/or Trading Day)
- The Turn-of-the-Year (January Effect/End-of-the-Year)
- Day-of-the-Week (DOW) Effect
- Holiday Effect
- Tax Payment Date Effect
- Turn-of-the-Month (End-of-the-Month) Effect
- Mid-Month Effect
Seasonal
- Month-of-the-Year (lacks specificity)
- Strong/Weak Season (Favorable/Unfavorable Season)
- *Sell in May & go away, buy again on Leger’s day is a strategy, not an effect
Cycles
- Political-Fiscal (4-year cycle/Presidential cycle)
- Generational Cycles
Without a tax-deferred account, the tax consequences of trading does need to be considered, but can be mitigated by longer term cycle considerations such as the four year political-fiscal cycle. The most common fallacy financial journalist when writing about the seasonality is the lack of full cycle analysis and the literal use of the simplest Sell in May resulting in only marginal increases in returns over buy & hold if held in cash when not invested. This type of analysis is surely supported by the “never say sell” financial world that earns a living off fees only when retail investors are invested. When evaluating any investment strategy, including seasonal strategies, investors need to pay careful attention to the start and end date of the reported returns. The strategies or advisor should be analyzed based on the results of at least one full market cycle (bull/bear) and from approximately the same part of the cycle (peak-to-peak or trough-to-trough). Three to five year returns do not meet this requirement.
Our members have access to an advanced seasonal strategy and more in-depth charts and tables looking at long-term and near-term results for key indexes and TSP funds. By slicing and dicing historical data from multiple angles, we are able to cull out statistical anomalies from actual seasonal tendencies and determine the time frames with the highest average returns and highest winning percentage and just as important the weakest time frames with the highest percentage of losses. Seasonal filters can be used both as stand-alone strategies or as value-added investment tools along with fundamental and technical analysis. It is our view that Seasonal Analysis provides investors better situational awareness of the markets from which to make more timely allocation decisions and is soundly rooted in historical studies.
* The saying “Sell in May and go away, buy again on Leger’s day” goes back to when London stock brokers took the summer off to launch their daughters into high society and enjoy the sporting season of Ascot, Cowes, Henley and so forth, ending with the St Leger flat race during the second weekend in September. With professional investors away racing and shooting over the summer, their return in October to April came to be seen as the serious months for investing, when markets would rise strongly. Today, many senior Wall Street partners spend their summers in the “the Hamptons” leaving junior partners to man the helm during the summer, again returning in the fall. While only antidotal, this is considered one of the causes of the summer lull in the stock markets going back over hundred years.
Next....
Mitigating Risk with Seasonal Filters