


-
-
-
-
The January Effect
-
-
-
-
-
the january effect
The January Effect
by Michael H. Bond
TSP Smart & Almanac Smart Investor
Much like the term “Santa Rally” you will hear various definitions and explanations of the term “January Effect” in the media. I was originally going to lead this guide with the Investopedia and Wikipedia’s definitions, but the definitions were lacking and I did not want to create any confusion. I will provide them at the end instead. As always, what matters the most for investors is the historical performance of the stocks and determining if the effect is still tradable or in the case of the January effect should one shift investments to small cap stocks. I will not attempt to define the term, but a general discussion of effects is warranted.
Longitudinal studies of seasonal tendencies show some tendencies have shifted over 30 and 50 year time frames or when seasonal drivers of money flows have changed. The January effect is one of these shifting tendencies and careful examination of the effect needs to be considered prior to making investment decisions based on past studies. The term “January Effect” denotes the performance of the entire month and has been studied as such in many academia papers and by financial journalist. But like all seasonal effects, they do not start or stop at month's end nor are they perfectly consistent over time.
When studying seasonal tendencies of any equity index, it is necessary to define the index and the time frame examined. The longer time frames are excellent for academic studies but for investors we need to know if the effect still exists and will it provide a good risk-adjusted return. Monthly returns are inadequate for studying the effects in detail. We can forgive academia’s use of monthly returns when looking back over 300 years, but as an investor you need more fidelity – simply put, stocks trade on a daily basis, not monthly.
Explanations for the effects are hard to pin down, but a few studies have done a better job than others. Most reasons given are merely strong hypotheses. The explanations are not necessary for investment purposes, but they might help refine investment strategies to increase risk-adjusted returns. We will not go into detail here on what might have caused a January effect.
Is the January effect tradable?
Looking at our own almanacs from 1950-2013, January was the 5th best month for the S&P500 index - a good month, but not the best. Looking at the last 13 years, the S&P 500 index was slightly negative on average (-0.3%) and in 8th place out of 12 months. But the pre-election year January has been one of the best months to be in stocks of all 48 during the four-year cycle. So much so that if you subtract the pre-election January performance from the total of all four years you find the other three Januarys had little to no gain on average the last 63 years. 2016 is an election year, not a pre-election year.
The small caps have performed slightly better than large caps the last 13 years (0.8%), but January was tied for 7th when defined in terms of the total US stock market minus the S&P 500 stocks the last 13 years. The preceding 13 Januarys (1988-2000) had a 10-0-3 track record and were the third best month of the year during the bull market. This track record is in agreement with the longitudinal study as seen in the figure below.
Over the last 300 years, January has experienced long periods of above average performance and periods of below average performance. During this century its above average performance gained notoriety and received academic review and support. But recent historical analysis shows January has been a neutral month on average since 2000. To be clear, the January effect as defined as an outperforming month has not been the case recently... or it may have even reversed.
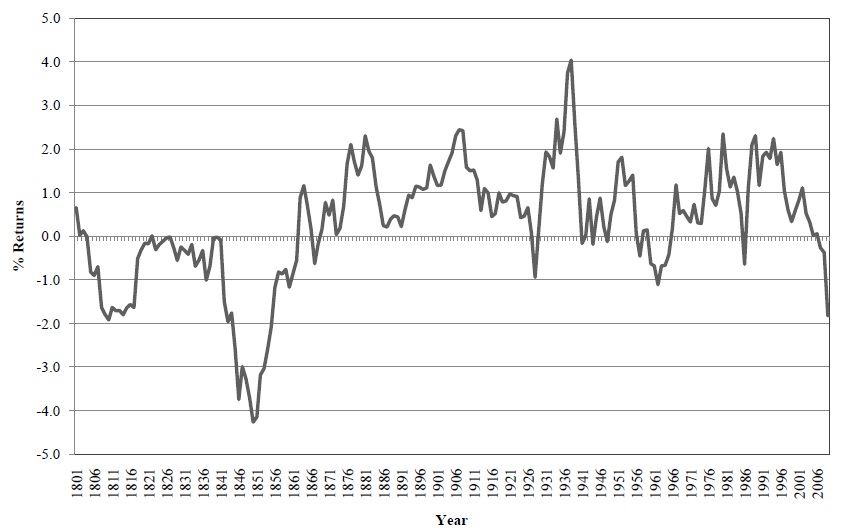
US Market: 10 year moving average of the difference between January and
the average returns for the other 11 months (Jacobsen and Zhang)
Below is an excerpt of our 2015 almanac for the first few days of the month. The 16 pre-election years captured much of the early January gains from 1950 - 2013. (Note: Percentages are cumulative daily totals for the years listed)
Of note, January 2014 and 2015 were down 1.9% and 1.8% respectfully for the TSP S fund (non-SP500 small caps) and down 3.5% and 3.0% respectfully for the TSP C fund (SP500). So while you could say the small caps outperformed the large caps, they were still down the last two years but the markets did bounce back in both Februarys.
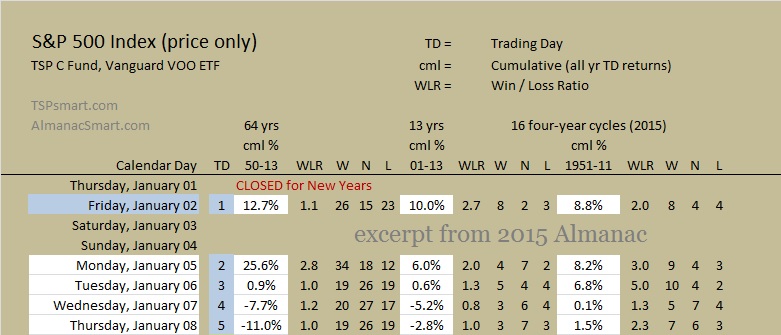
Excerpt of TSP & Vanguard Smart Investor 2015 Trading Day Almanac
The bottom line for us is that the January effect itself is not tradable, but the early days of January have been a part of the Turn-of-Year effect that starts in December and believe is tradable. Each January is different and the numbers provided are the averages, but the averages show the first two trading days of January remain positive and the entire month of January has historically been strong during pre-election years. Since 2000 January has become a neutral month from a seasonal perspective and investing in successfully in January requires using other investment factors, analysis, or strategies.
Other strategies incorporating January
Strategies designed to capture the Turn-of-Year effect (a refined Santa Rally) incorporate the early part of January, but all variations of the Sell-in-May strategy successfully include all of January as part of a longer time frame to be invested in equities. In a study that examined over 300 years of England’s stock market, the only consistent seasonal tendency analyzed was the simple Sell-in-May strategy that beat the market 82.11% of the time over any 5-year investment horizons and 91.56% of the time over any 10-year investment horizons.
This same effect was found by Bouman and Jacobsen (2002) to exist in 36 out of 37 countries studied. This is why we chose the effect as the basis of our own more advanced Seasonally-Modified Buy & Hold strategy. But our own studies show that even this consistent tendency has some variation among the indexes especially when comparing small capitalized stocks to large capitalized stocks and adjustments in investment strategies are necessary to fully capitalize on each index’s tendency.
Seasonal strategies improve your risk-adjusted returns
What are risk-adjusted returns? The most important take-away from this section is that risk-adjusted returns mean you should sometimes accept a lower return in the short-term in order to gain much higher returns in the long-term. This is not an academic answer, but how I consider risk-adjusted returns. You can see this in the longitudinal study results described above where the "Sell-in-May" strategy's results compared better over the longer time horizons. This has to do with the bull/bear market cycles of the market that have occurred in four to ten year cycles throughout stock market history and see most of the market's drawdowns occur during the summer/fall months.
My use of the term risk-adjusted returns is focused on broad index funds that by their nature have already mitigated much of the individual and sector risks and leave primarily market risk. Market risk in its simplest terms is market declines in excess of the normal daily ups and downs of the market. So for our purposes market risk also equates to market exposure. Achieving the same return in half the trading days would in effect double your risk-adjusted return. The advantage of a better risk-adjusted return or reduced market exposure in the short term is both the ability to generate additional return in low risk assets and the avoidance of black swan events or market corrections when out of equities (such as the TSP G fund).
Definitions with comments
INVESTOPEDIA’S DEFINITION of 'January Effect'
A general increase in stock prices during the month of January. This rally is generally attributed to an increase in buying, which follows the drop in price that typically happens in December when investors, seeking to create tax losses to offset capital gains, prompt a sell-off.
The January effect is said to affect small caps more than mid or large caps. This historical trend, however, has been less pronounced in recent years because the markets have adjusted for it. Another reason the January effect is now considered less important is that more people are using tax-sheltered retirement plans and therefore have no reason to sell at the end of the year for a tax loss.
The first sentence of the definition could be said about most of the months of the year. The second issue with Investopedia’s definition has to do with the misleading statement “follows the drop in price that typically happens in December”. December is one of the best performing months for stocks, including small caps. There is a mid-month drop, but the end of the year rally more than makes up for this on average. So yes, if we can infer the rally continues into the first part of January, but not all of January.
As for small caps outperforming, small cap stocks do show greater volatility and also greater seasonal tendencies overall. So if the season effect is in force, then the small caps will tend to outperform large caps for most seasonal effects. On average small caps are still performing better in January, but not enough to make an late adjustment in your allocations.
Wikipedia’s DEFINITION of 'January Effect'
The January effect is a hypothesis that there is a seasonal anomaly in the financial market where securities' prices increase in the month of January more than in any other month. This calendar effect would create an opportunity for investors to buy stocks for lower prices before January and sell them after their value increases. As with all calendar effects, if true, it would suggest that the market is not efficient, as market efficiency would suggest that this effect should disappear.
The effect was first observed around 1942 by investment banker Sidney B. Wachtel.[1] He noted that since 1925, small stocks had outperformed the broader market in the month of January, with most of the disparity occurring before the middle of the month.[2] It has also been noted that when combined with the four-year US presidential cycle, historically the largest January effect occurs in year three of a president's term.[3]
The most common theory explaining this phenomenon is that individual investors, who are income tax-sensitive and who disproportionately hold small stocks, sell stocks for tax reasons at year end (such as to claim a capital loss) and reinvest after the first of the year. Another cause is the payment of year-end bonuses in January. Some of this bonus money is used to purchase stocks, driving up prices. The January effect does not always materialize; for example, small stocks underperformed large stocks in January 1982, 1987, 1989 and 1990.[4][5]
Wikipedia does not provide support to their statement that “prices increase in the month of January more than any other month.” What stocks, what index, what time frame? This is in contrast to what I presented, but may have been true at some time in history. A true statement would be that the prices in January increased more than the average monthly return until 2000. Otherwise, I generally agree with their definition and I am always amused when market efficiency is brought up.
Most proponents of the Efficient-Market hypothesis have a hard time with the concept of seasonal tendencies of the stock market. But they shouldn’t. If you look at commodity prices, the seasonal tendencies are so strong and obvious they are accepted as fact. Seasonal tendencies in the stock market do fit into John Maynard Keynes theory of the The General Theory of Employment Interest and Money under the heading of "motivating factors for investor liquidity preferences". In other words, investor money flows into and out of the market at different times of the year for good reasons (to pay taxes, Christmas, tax-loss selling, to go on vacation and not worry about risk, monthly pay checks and automatic retirement investments).
Final Comment
It is my belief that the long-term seasonal tendencies (spread out over the year or years) will not be eliminated by Wall Street’s short term focus. Combining seasonal filters with technical analysis can improve results since the two indicators have no correlation. Presently for January as a whole, other analysis is more important to consider and at all times other types of analysis should be used to increase your returns. In order to be successful trading seasonal market tendencies, you need low transaction costs, refined data, and a sound long-term strategy.
If you want detailed trading day (versus) calendar day seasonal data, you might want to check out our almanacs.
We also provide the daily seasonal after eliminating the volatile bear market years - our charts show the effect. We provide the SP500 index with over 60 years of data and the SP500 and the non-sp500 companies data since 1988. All presented side-by-side and with charts that paint the picture. The Santa Rally stands out, but so do other patterns.