-
-
-
-
FOMC Statement Price Pattern
-
-
-
-
-
  TSP, Vanguard, Fidelity, Schwab, all serious investors  | >> Follow via |
FOMC Statement Price Progression
October 2015 FOMC price action matched perfectly
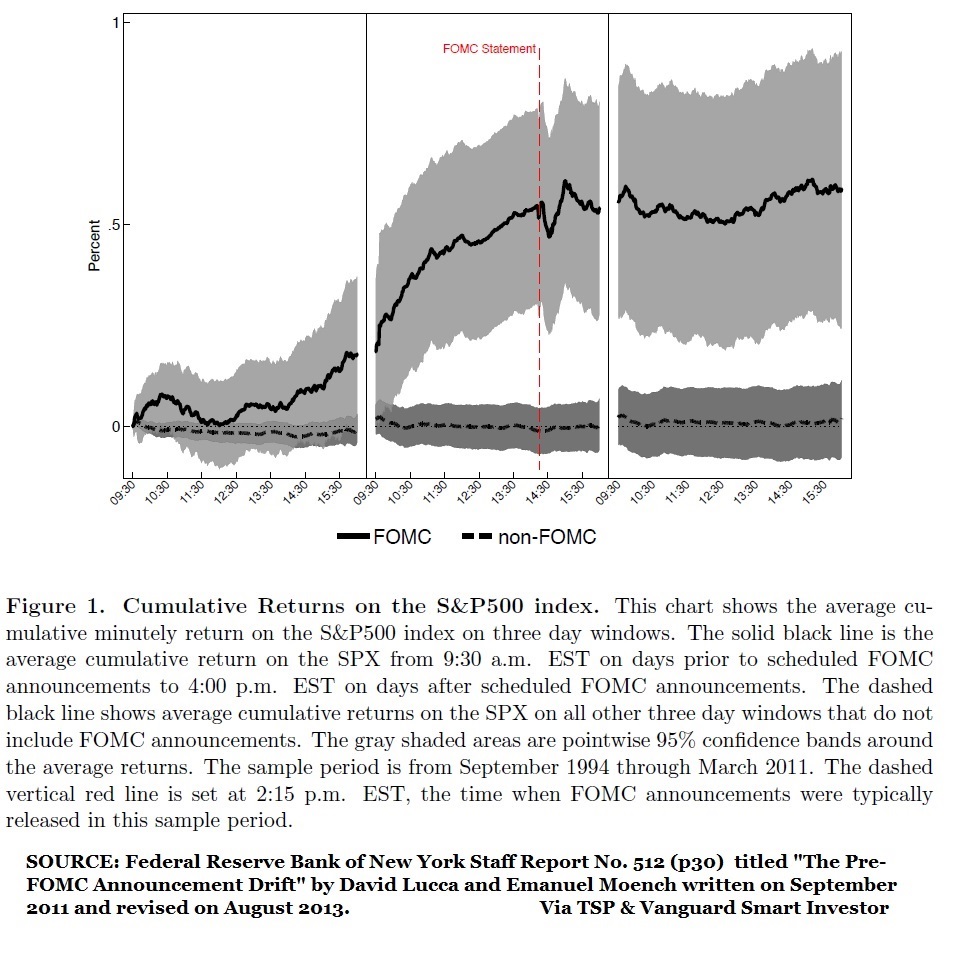
The source of this information is from a Federal Reserve staff paper and highlights the fact that the study of "seasonal anomalies" is not limited to a few investment websites. I call them seasonal tendencies and their effects can exist based on the time of day, a calendar day or calendar event such as the FOMC statement shown below, or periods of time such as the favorable and unfavorable season for equities. While many of these event based tendencies are not tradable for most individuals, an understanding of them should be another tool in an investor's tool box.
What is not broken out in the chart below is the time of the year each statement was made or whether the FOMC statement was welcome by the market or not. I would venture to guess, the statements were generally expected to be market positive which leads to the front running of the expected statement. There are 8 announcements per year, which makes the following chart more remarkable since it implies the market gained 4% on average per year in the eight trading hours (64 hours total) leading up to the announcements in each year from 1994 until 2011.
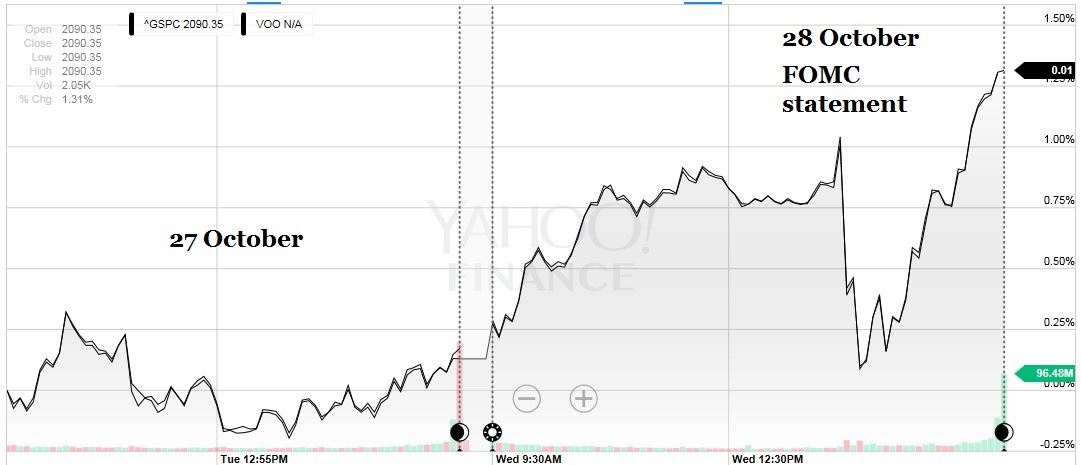
Compare the below average FOMC price progression to 28 October 2015 FOMC announcement pattern. Amazingly close.