

-
-
-
TSP Tracked Indexes
-
-
-
-
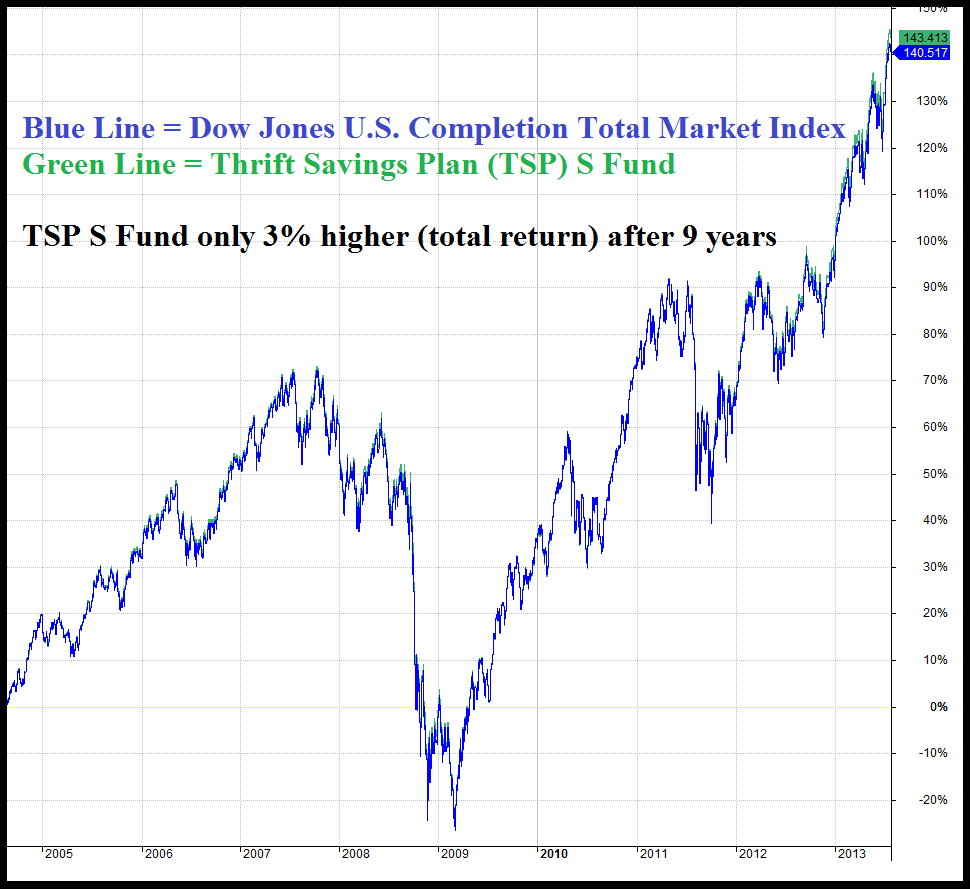
TSP S Fund & the Vanguard VXF ETF track the Dow Jones Total Market Completion Index
The charts below illustrate how the Thrift Savings Plan (TSP) S Fund and the Vanguard VXF ETF tracks the performance of the Dow Jones U.S. Completion Total Market Index. Note the index (blue) almost perfectly overlaps the TSP S Fund (green). Notice in the right column that the TSP S fund's total return over approximately 9 years displayed is 143.41% verses 140.52% for the Completion Index.
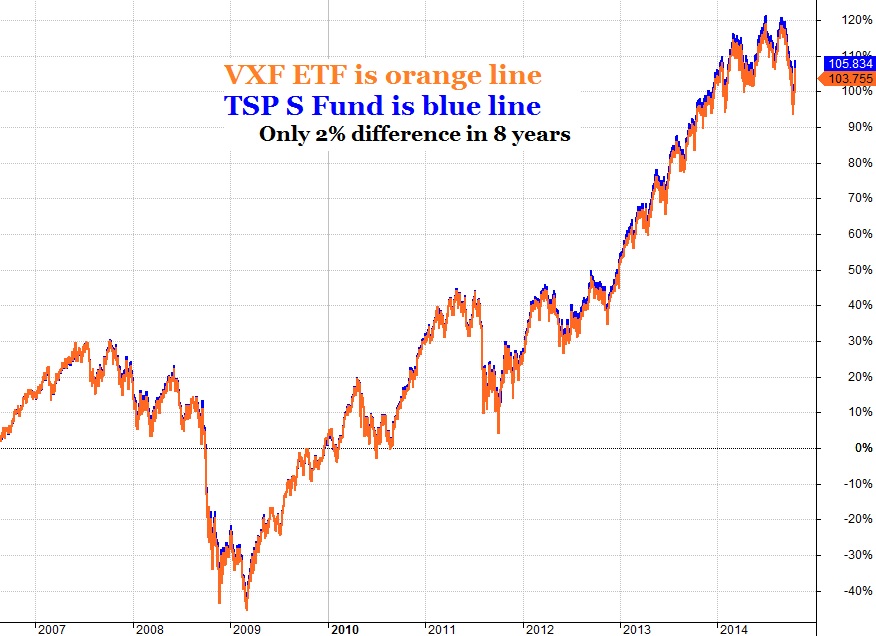
While the TSP S Fund has only been in existence since 2003, the Completion Index began in 1987 and can be used as a proxy for charting the TSP S Fund looking back beyond 2003. This second chart compares the TSP S Fund with the Vanguard VXF ETF which tracks the same Market Index. The difference is also negligible and allows us to use the VXF ETF for real-time snapshots of the S Fund's daily or weekly performance.
The following chart demonstrates the strong seasonal tendencies of the small cap index. I often call it the non-SP500 index for short since it is tracks all the US listed stocks that are not in the SP500 index. Although there are 3384 stocks in the index, it only comprises about one quarter of the market value of the largest 500 companies. Typically small cap stocks are more volatile in price and this is seen in the favorable and unfavorable months for equities.

More About Us