

-
-
-
-
-
-
Hussman on the Fed Model
-
-
-
Dr. Hussman on the Fed Model
The Fed Model is an artifact of just 16 years of history
There’s an additional problem. While it’s compelling to believe that the expected return on stocks and bonds should have a one-to-one relationship, history doesn’t bear that out at all. Indeed, over the past century, the correlation between bond and stock yields has historically gone in the entirely wrong direction except during the inflation-disinflation cycle from about 1970 to 1998. What investors may not realize is that the correlation between interest rates and earnings yields (as well as dividend yields) has been negative since 1998. Investors across history have not been consistent at all in treating stocks and bonds as closely competing substitutes.
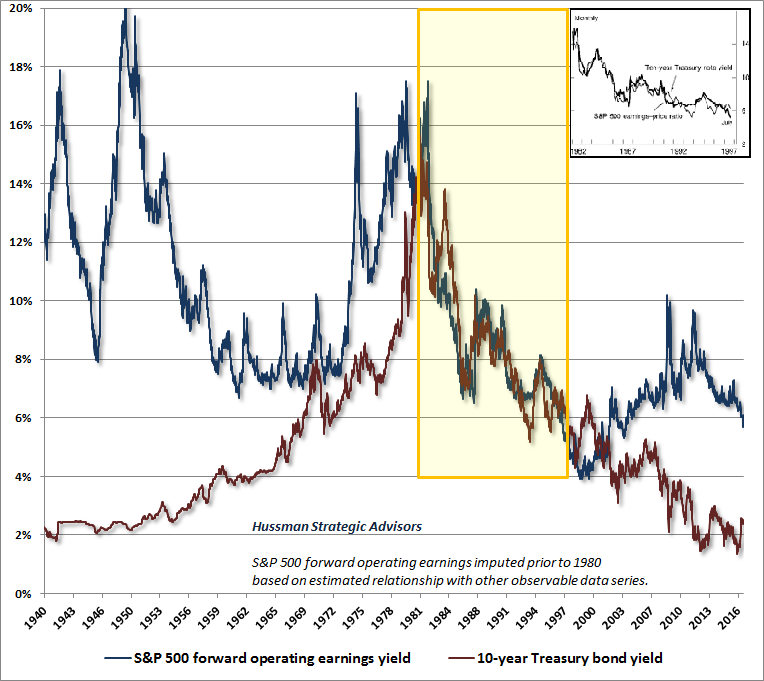
As I noted during the bubbles that ended in 2000 and 2007, the problem with the Fed Model (which compares the S&P 500 forward operating earnings yield with the 10-year Treasury yield) is that this presumed one-to-one relationship between stock and bond yields is wholly an artifact of the disinflationary period from 1982 to 1998. The stock market advance from 1982 to 1998 represented one of the steepest movements from deep secular undervaluation to extreme secular overvaluation in stock market history. Concurrently, bond yields declined as inflation retreated from high levels of the 1970’s. What the Fed Model does is to overlay those two outcomes and treat them as if stocks were “fairly valued” the entire time.
The chart below shows the S&P 500 forward operating earnings yield alongside the 10-year Treasury bond yield. The inset of the chart is the chart that appeared in Alan Greenspan’s 1997 Humphrey Hawkins testimony, and is the entire basis upon which the Fed Model rests. The same segment of history is highlighted in the yellow block. Notice that this is the onlysegment of history in which the presumed one-to-one relationship actually held.
Descriptive versus predictive
The Fed Model is not a fair-value relationship, but an artifact of a specific disinflationary segment of market history. It is descriptive of yield behavior during that limited period, but it has a very poor predictive record with regard to actual subsequent market returns.
When investors assert that stocks are “fairly valued relative to interest rates,” they are essentially invoking the Fed Model. What they seem to have in mind is that regardless of absolute valuation levels, stocks can be expected to achieve acceptably high returns as long as the S&P 500 forward operating earnings yield is higher than the 10-year Treasury yield.
No, no. That’s not how any of this works, and we have a century of evidence to show it. The deep undervaluation of stocks in 1982 was followed by glorious subsequent returns. The steep overvaluation of stocks in 1998 was followed by one crash, then another, which left S&P 500 total returns negative for more than a decade. I fully expect that current valuations, which are within a breath of 2000 extremes on the most historically reliable measures, will again result in zero or negative returns over the coming 10-12 years. Let’s dig into some data to detail the basis for those expectations.
The following are estimated correlations between various valuation measures and actual subsequent 10-year and 12-year S&P 500 total returns, ranked from strongest to weakest.
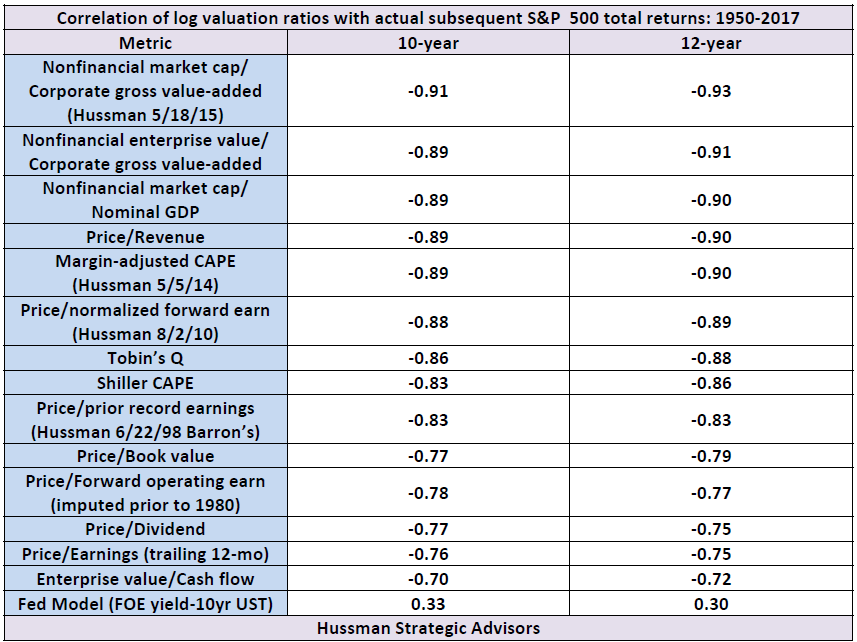
Hussman on the Fed Model with Table above here