-
-
-
About
-
-
A sample of our alerts
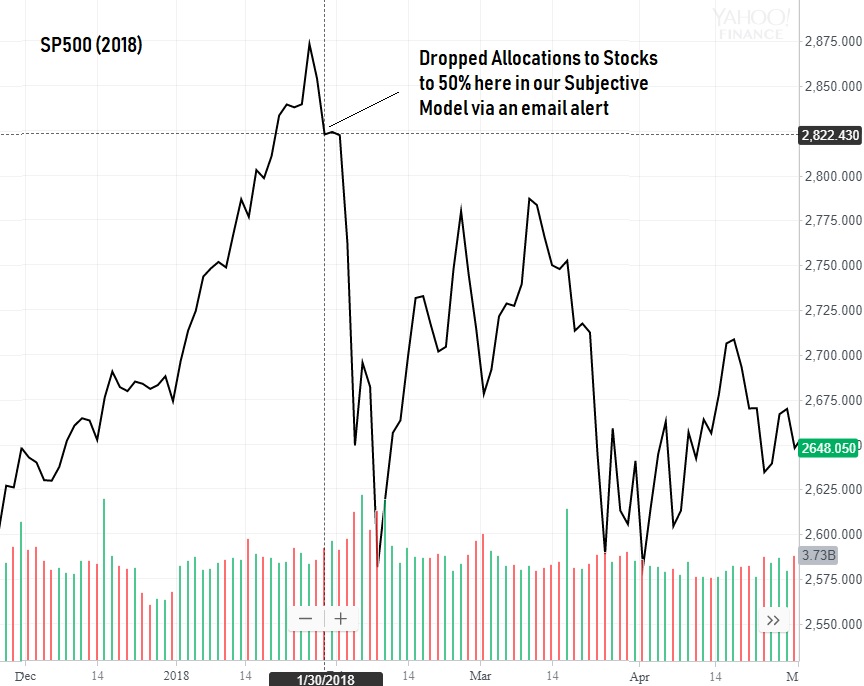
on 30 January 2018 via email alert...
I am reducing our allocation level to 50% in my subjective timing model on 31 January 2018.
Discussion: Our risk indicator remains in the Safe Zone. Stock market internals are fine, so why the shift?
Parabolic moves in the stock market are not normal and once they stop advancing everyone's technical signals
quickly reverse and then selling creates a negative feedback loop.
our 18 August 2015 interim update warned ...
Market internals remain weak and have for some time. Aversion to risk as measured by credit spreads in the bond market have now reached levels that historically been met with significant market corrections ... in the stock market within weeks.
Note: Our models were already out of stocks in August but we sent the email alert as advertised.
our members avoided significant losses...
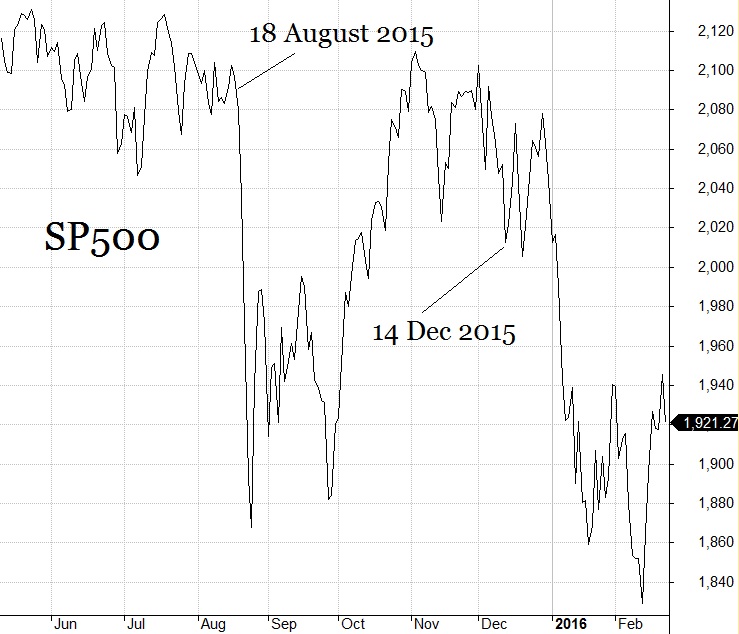
again in our 14 December 2015 Special Timing Report we warned...
...our risk aversion indicators are indicating a potential market crash anytime in the next few weeks...
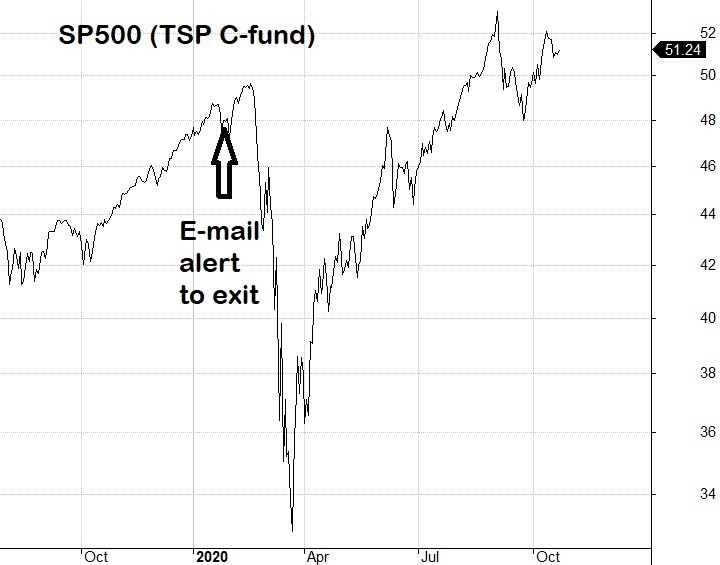
In early 2019, our seasonal models were fully invested in the stock market and my subjective model was holding a reduced allocation to equities due to problems in the Repo Markets. The Federal Reserve had to flood the repo markets in late 2018 and the market surged. Early in 2019, the Fed withdrew support from the Repo Market and our Risk Indicator signaled risk averse investors were stepping out of the market. We sent an email warning to exit the market on 27 January 2020 and missed the crash...
The above four warnings are the only warnings we have sent out since 2012. This does not mean we have recommended going 100% equities at other times. We have been defensive and will stay defensive with our allocations until the market bubble is allowed to reset. And by "allowed" I mean this market is being overly supported by global activist central banks. Is that good?
Support stock and bond market prices does not impact the future cash flows of these corporations. Meaning high prices with unsupportive future profits and cash flow means the long-term returns of this market is at a historical low. Some time in the future reality will catch up to prices. Meanwhile we have to trade the market we have, but remain defensive. Buy and hold and the 60/40 portfolio will be devastating over the next 5-10 years.
Invest safe, invest smart
what Wall Street does for you ...
Wall Street ‘experts’ have missed every stock market crash in 20 years Market Watch
Did your financial adviser warn you? If so, keep them, otherwise keep reading.
Our simple-to-execute seasonally-modified buy & hold strategy
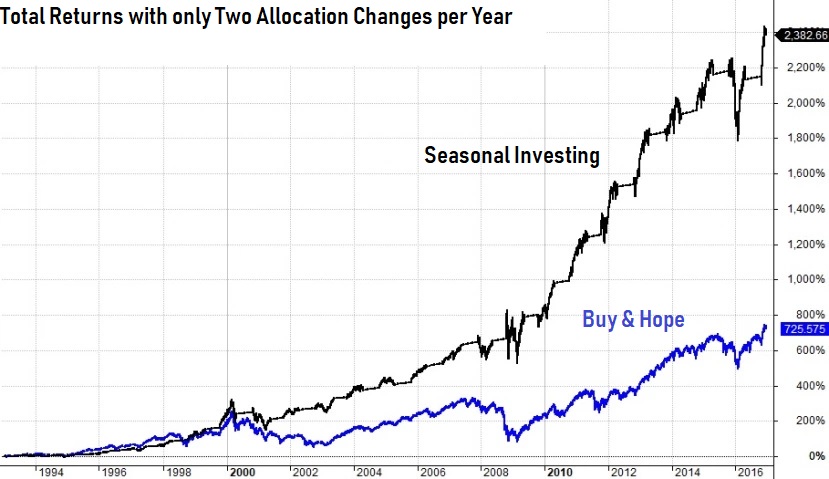
The simple act of missing the time of the year that is historically weak for the stock market leads to one of the few strategies that beats buy and hold.
The black line shows the results of only two allocation changes per year based on our total market signal.
Those who stop chasing short-term returns can beat buy & hold significantly over the course of the full market cycle (bull and bear markets) as seen in the chart.
You can read about the results of the strategy for each fund using the best TSP strategy.
Our basic level of service is only $85/year or currently $75 if you sign up via annual autopay. ($185 for full access with almanacs).
We offer three levels of service - they all come with market warnings via email. Scroll down to see what each option provides.