

-
-
I. TSP Allocation Advice
-
-
-
-
-
-
best TSP allocation strategies
TSP Allocation Advice
Current Allocation recommendations requires membership, but this guide is a start to understanding the funds much better than the TSP.Gov web information.
We will walk through the following:
1) fund performance characteristics and their drivers
2) develop a rough idea where we are in the market cycle (bull/bear/bubble/bust) so you can
3) lean on the equity funds during bull markets or the safe funds during high risk markets...
...without making many allocation changes.
But first we need to start with the basics and my definition of risk.
Introduction
Best TSP Fund
Which Fund is best for TSP?
This section is designed to open your eyes to some factors that should inform allocation decisions. They are typically not covered in most marketing materials or considered in ready-made plans such as Lifecycle funds and Robo-advisors. If you see an adviser or marketing material that simply lists portfolios from a) most aggressive to c) conservative based on simply allocations to the different TSP funds, RUN AWAY. You will understand in a few minutes.
The basics
You have six real choices today - the five basic funds and the Life Cycle fund. They are all diversified, low-fee choices but some are better than others. The Life Cycle Funds simply allocate to the five basic funds for you, but as you will see this has not been beneficial to your risk-adjusted returns.
Your most important decision is deciding how much to risk in equities versus playing it safe... depending on the changing level of overall risk in the markets. This is where my opinion differs. I do not think "risk" is static over time and you need to adjust to market risk and not just your years-to-retirement or some robo-determined formula.
I need to contrast the definition of "risk" here. By risk, I am talking about the risk of you sustaining large losses in the near future... as opposed to the standard industry discussion of risk being how much volatility you can stand to see in your overall portfolio. Academia came up with portfolio theory which says split your allocations with a 60/40 mix of stocks to bonds or a more aggressive 70/30 mix and re-balance to "reduce volatility" of your balances. It does reduce the amplitude of losses as well as gains, but over the full market cycle it has little impact on total returns.
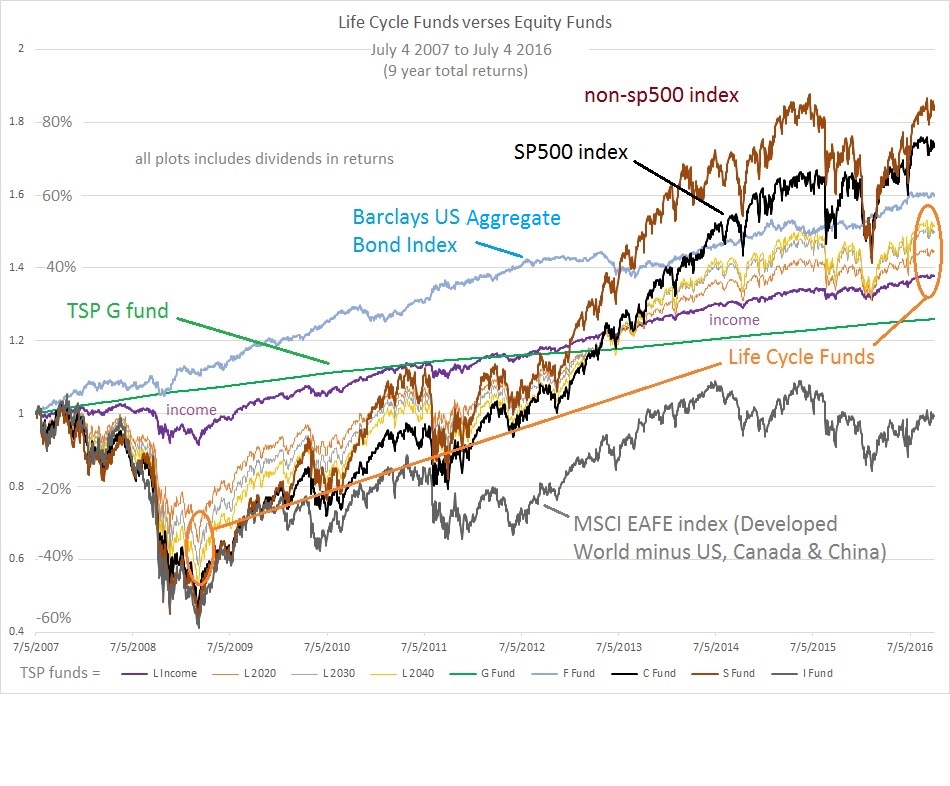
This next chart shows the relative performance of all the TSP funds during a bear market and the follow-on bull market. I like to use the TSP G fund as a risk-free baseline since it is supposed to cover inflation and is stable. The next "safest" fund is the TSP F fund (light blue) which tracks the Aggregate US bond index which has become dominated with Treasuries. While it was a great option during the shown time period, it can not repeat unless US interest rates go *negative*. From a volatility point of view, these "safe" funds did not plunge and rally and so were less volatile and considered less risky in mainstream thinking.
How diversification really works
The Lifecycle funds (yellow to brown) provide a perfect picture of how diversification works. Most of these funds hold high level of equity funds with some of the two safe funds. You will note that they indeed did not plunge as much as the TSP C fund (black) or TSP S/I fund, because of their allocation to the more stable TSP G and F fund. The more safe funds the less the Lifecycle fund plunged with the least being the Lifecycle Income fund for retirees that is prodomently in the TSP G fund. With the Income fund it was the equity funds that took it down a bit in 2008.
Once the bear market was over and the riskiest funds had finished plunging, they started what is called a bull (rising) market but it was not until around 2013 that all the equity funds broke-even with the TSP G fund. All the funds heaviest in equities and lighter in the safe funds outperformed on the way up. Look at how most of the Lifecycle funds caught the TSP G fund at the same time as the TSP C fund. The level of diversification mainly determined amplitude on the way up and down. And thus they all broke even about the same time.
The chart above makes it painfully obvious that shifting to the safe funds somewhere, anywhere close to the top and re-entering equities (stocks) after the *next* bull market was confirmed to be underway would deliver significantly higher long term returns than deciding whether to be in the TSP S fund or the TSP C fund. But we are getting ahead of ourselves here.
So here is my take-away about diversification
When you hear about diversification the academic definition includes buying several diversified funds in equities and bonds. TSP makes this easy in that the TSP C fund tracks the SP500 large company index that accounts for 75-80% of the total US stock market *value*. The TSP S fund tracks what I call the non-sp500 companies which are the other 3500 US companies not in the SP500. These smaller companies account for 20-25% of the total US stock market *value*. So these two funds are basically the total US stock market.
Note: To diversify into the total US market balance, you have to allocate 3 parts C fund to 1 part S fund, otherwise you are over-weighting small caps. This is how the Lifecycle funds does it.
The Lifecycle funds today are allocating LESS in the stable funds than they did during the 2008 bear market seen in the chart above. This means most Lifecycle funds will more closely track the losses of the TSP C fund during the next bear market. They are also capturing more of the gains during the bull market phase. The Lifecycle funds have also being held back by the TSP I fund performance this bull market.
So, diversification can reduce volatility of your total portfolio, but over the *full market cycle* you are simply riding the overall market volatility at slightly different amplitudes. Again, you lose less in a bear market, but you gain less in a bull market when you diversify and hold long term.
Note that from 2007 to 2019, the TSP I fund only broke-even after 12 years and it had underperformed the lowly TSP G fund by 25%. We will talk about how the gains of the TSP C and S fund have been unnatural this cycle and the price you are paying today for $1 of SP500 revenue is 3x as much as the beginning of the bull market. Meaning price wildly outran revenue growth. It will have to revert in the next bear market.
Why does this risk matter...
...Because in the long run, the #1 determinate to the performance of your retirement fund is avoiding those heavy losses, period, dot.
Every long term stock chart is misleading. A 50% loss looks the same as a 50% gain, but in fact a 50% loss requires a 100% gain to breakeven. So avoiding part of the last two bear markets could easily have doubled your returns even while holding less risk in your portfolio during the bull markets.
The SP500 index lost over 50% twice since 2000. The top 100 companies in the Nasdaq lost over 80% from their 2000 peak. They all came back, but after many years.
The real point is the market DOES cycle. And it cycles more in terms of valuation or what people are willing to pay for a $1 of SP500 revenue or earnings than how much the SP500 revenue cycles. The SP500 revenue growth is pretty steady over time, but you would not know it looking at the charts of the SP500 index price.
So guess what...
...price can run away from revenue and earnings of the companies and often does, but it has its limits. And we know that in the long, long run the two have to move together therefore we have bear markets (declining markets) to re-connect them. Spoiler alert: We have never had a flat stock market waiting for revenue and earnings to catch up. We have had a series of cyclical bull and bear markets reconnecting the two and this is called a secular bear market.
We are due for a secular bear market. The separation between US stock prices and revenue or earnings has NEVER been higher (Sept 2021) and it will take a secular bear market to fully revert to valuations that actually offer a price that comes with long term 8% returns you read about. Meaning you can't buy and hope anymore. You are going to have to work for gains the next decade or so.
What about the TSP I fund (International fund)?
I provide this next chart to show the relative performance of the 3 TSP equity funds since the top of the last bull market in 2007. Over the 13 years presented, we see the two US funds performed about the same but with different levels of volatility on the way up. I have not recommended the TSP I fund this cycle and I will get to the reasons later, but it has most definitely underperformed the US counterparts. The TSP I fund is made up of the developed world's large companies outside the US with the bulk being in Europe and Japan.
A *geographically* diversified portfolio would include the international equities based on their market valuation in relationship to the US fund's market value. This is how the TSP Lifecycle funds work. And by geographically, we are talking location of the company's stock market listing not where they do business.
So here is the question:
Does geographically diversifying based on valuations provide a smart portfolio? Academia and marketing does not seem to question it. But you can look a tad deeper into what you are really buying in terms of sectors, and where the revenue comes from or valuations you are getting. We will do this.

Let's look under the hood of these 3 TSP equity funds and see if we can find reasons for their different performance at different times.
Best TSP Strategy
Here are common strategies I see from new investors: 1) No strategy, no decisions especially if balances are low 2) Buy and Hold then Hope then Panic sell at the bottom, 3) Rearview Mirror Strategy - chasing the best returns by looking at 3 to 5 year or even 3 to 5 week returns, 4) Seasonal strategies but on a weekly basis and ignoring all other factors, 5) Follow others online, 6) Lifecycle funds - which is really a buy and hold strategy.
Guess what? Most of these strategies can work pretty good... during a bull market. Everyone is a good investor in bull markets and they all become geniuses in bubble markets. As long as the market keeps bouncing back and moving higher investors become even more embolden and often take on more risk (more equity funds) as time goes by. We know from history that retail investors are the most allocated to stocks at bull market tops and the least allocated at bear market bottoms. Funny how that works out... or is this what determines tops and bottoms.
You can't time the markets? Hmmm, how do you think wall street makes money. I do NOT advise trading weekly or monthly with retirement funds. A little set aside in a different account to speculate is fine, but the average bear market loses 80% of the proceeding bull markets gains. The last bear market lost 110% of the 2003-2007 bull market. So speculating can be hazardous to your retirement. Missing out on gains is not the same as losing your savings near retirement. I hate missing gains too, but it is the losses that devastate accounts.
What is the Best TSP Strategy?
If you had a crystal ball, the best TSP investment strategy would be easy. Invest in the best performing fund during bull markets and sit in safest funds during the bear market. But many investors have followed the opposite strategy - buy, hold, then panic, then delay re-entry. You can not time the top of a bull market (rising) or the bottom in a bear market (falling), but you can save yourself a lot of heartache and stress by being close and allocating based on the changing market risk - the risk of large losses.
Mainstream investment strategies will tell you to take on "more risk" to get better returns. For short term speculation - maybe. But I have found that you increase your nest egg substantially more by reducing or avoiding market risk at the right times. Unlike mainstream advice, I do not define risk as static throughout time.
Buy & hold strategies are based on this belief risk is static or unobservable so they merely reduce volatility in returns over time by diversifying. I've warned about risk of large moves down that were foreseeable and led to us telling our members to exit equities completely in late January 2020 for example and several other times recently. So it is not impossible to observe risk and see the signs of it about to be released on the stock market.
TSP Allocation
I am 80% on board with Warren Buffet and John Boggle advice of sticking with low-fee broad indexes. Only eighty percent because that is how much of the time the market has spent in bull (rising) markets. It is that other 20% where the market loses most of the gains of the proceeding bull market that I am not on board with riding down.
I also do not believe in Bogle's advice of holding international bond funds as part of your diversification since you would be the sucker holding Europe's negative interest bonds today. Note: TSP does not invest in international bonds.
It can not be repeated enough - the last bear market in stocks gave up 110% of the previous bull markets gains. Why would you want to give up 10+ years of returns and have to wait to break-even.
We will look at strategies that reduce real risk - large market losses - while capturing most of the market's gains. No, not a crystal ball, but the best strategies we found that can be employed in TSP for long-term investors (not traders). Which will lead us back to the question "What is the best TSP fund to allocate to?"
Okay, we are about to transition to looking under the hood of each equity fund to understand why they perform differently.
Historical TSP performance charts and fund characteristics